

Employee engagement metrics help HR identify when engagement is declining and turn early warning signs into evidence. When employees become less vocal in meetings, strong performers begin to leave, or absence rates rise, these metrics give you data to bring to leadership with a clear recommendation.
Engagement influences the outcomes HR is often measured against. Engaged employees are more likely to stay, perform well, and contribute consistently. Disengagement can show up in turnover, absenteeism, productivity, and performance data.
The challenge is knowing which numbers to watch. This guide walks you through 10 employee engagement metrics worth tracking, how to measure each one, and a free template you can use to start today.
Contents
What are employee engagement metrics?
Examples of employee engagement metrics
How to measure employee engagement: 6 steps
Tools to measure employee engagement
Free employee engagement metrics template (PDF)
What are employee engagement metrics?
Employee engagement metrics are the data points that show you how engaged your workforce is, both directly and indirectly. Engagement itself is the extent to which your people feel a strong connection to the organization, commit to their work, and put in extra effort.
No single number tells you all of that, so you’ll want to combine two types of data. Survey-based metrics, like eNPS and satisfaction scores, tell you how your people feel. Behavioral and operational metrics, such as turnover, retention, and absenteeism, show how that feeling plays out in what they actually do.
When you track these together, you can see where engagement stands, catch problems before they escalate, and design interventions to improve employee engagement across your teams.

Employee engagement metrics vs. KPIs
You’ll hear these two terms used interchangeably, but they do different jobs in your reporting.
What is it
Any data point that reflects engagement
A metric you’ve tied to a target and track toward a goal
Has a target?
Not necessarily
Always, with a deadline attached
What it tells you
The overall picture of how engaged your people are
Whether you’re on track to hit a specific goal
How many you use
Track as many as are useful
Report on only three to five
Example
- Absenteeism rate
- eNPS
- engagement score
- Raise eNPS from +12 to +20 by Q4
- Cut voluntary turnover to 10% by year-end
- Lift survey participation above 85%
How to measure employee engagement: 6 steps
You measure employee engagement by choosing a small set of metrics, tracking them regularly, and acting on what they reveal. Here’s how to do it in six steps:
- Start with the question you’re trying to answer: Decide what you need to learn before you pick a metric. Worried about losing people on one team? Rolling out a new manager program? Your goal determines which metrics appear on your dashboard.
- Pair feeling metrics with behavioral ones: Read your survey scores next to hard numbers like turnover and absenteeism. If eNPS looks healthy but a team’s turnover is climbing, the behavior is telling you something the survey missed.
- Set a survey cadence. Run one in-depth survey a year for a full read, and shorter pulse surveys throughout the year to catch shifts early. Consistent timing keeps your results comparable.
- Establish a baseline, then benchmark: Your first measurement is the baseline you’ll track against. Compare it to external benchmarks where useful, though your own trend over time tells you more than any industry average.
- Segment your results: Break the data down by team, manager, location, and tenure. A company-wide average can look fine while it hides the one team that needs your attention.
- Act on the results and close the loop: Share what you found, commit to a few changes, and tell people what you’re doing differently. Measuring without acting is the fastest way to erode trust and sink your next survey’s response rate.
Examples of employee engagement metrics
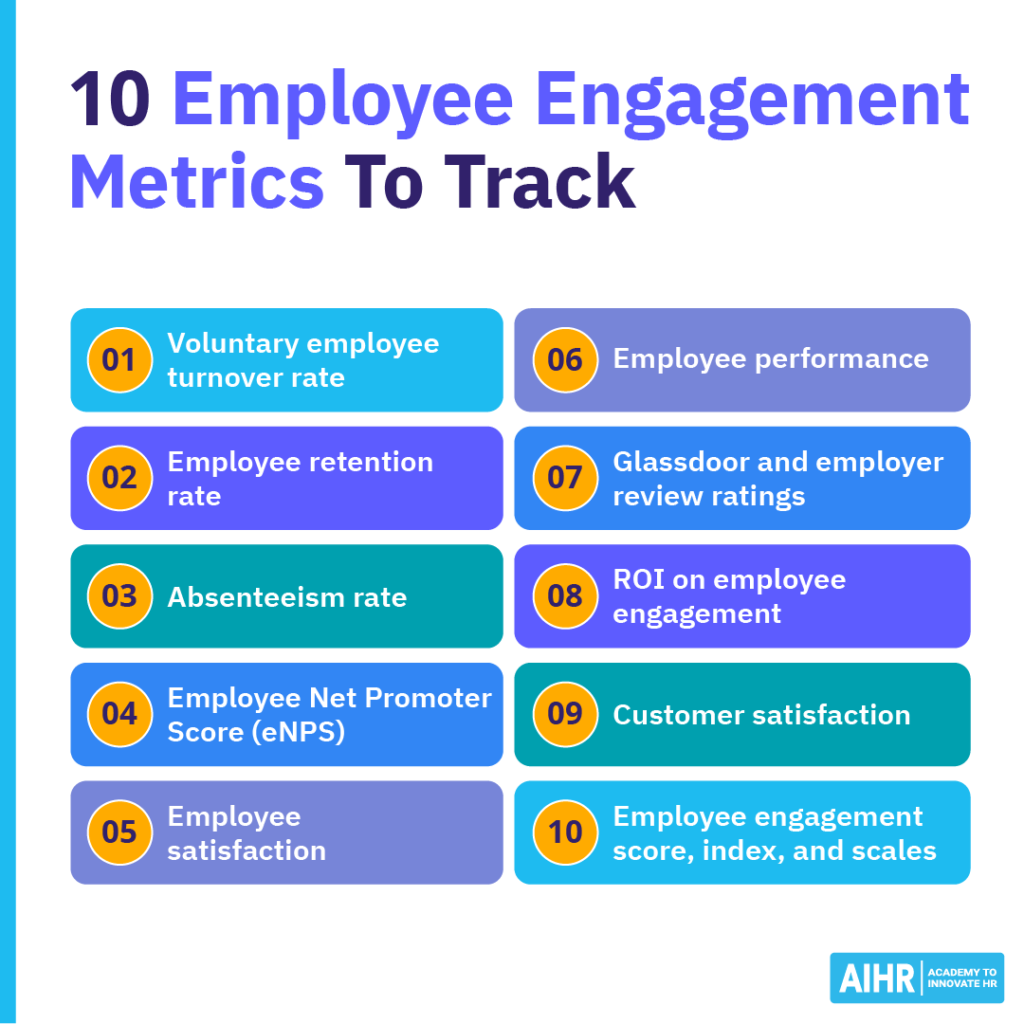
Below are 10 metrics for employee engagement you can choose from. Each employee engagement metric shows what it signals, how to calculate it, and how to use the result.
1. Voluntary employee turnover rate
What it signals: Share of your people who leave voluntarily over a set period.
Engaged employees are less likely to resign, so a rising voluntary turnover rate is one of the clearest indirect indicators of engagement, and a rising rate is often the earliest sign that engagement is declining. It is also costly, since each departure results in lost knowledge, increased team workload, and the expense of recruiting and onboarding a replacement.
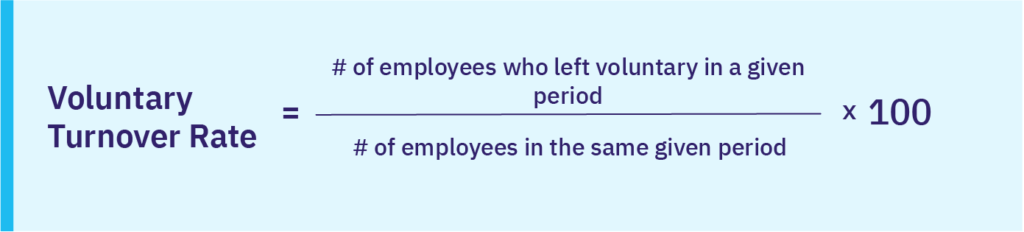
Analyze the rate by team and by tenure. A concentration of departures among high performers or recent hires shows where to focus first. Compare your voluntary turnover rate against the industry benchmarks to see how you stand.
2. Employee retention rate
What it signals: Proportion of your people who stay with the organization over a set period.
Retention is the counterpart to turnover, focusing on the people who stay. A strong employee retention rate reduces onboarding costs and preserves institutional knowledge. The longer employees stay, the better they understand internal processes, which supports both productivity and a stable culture.
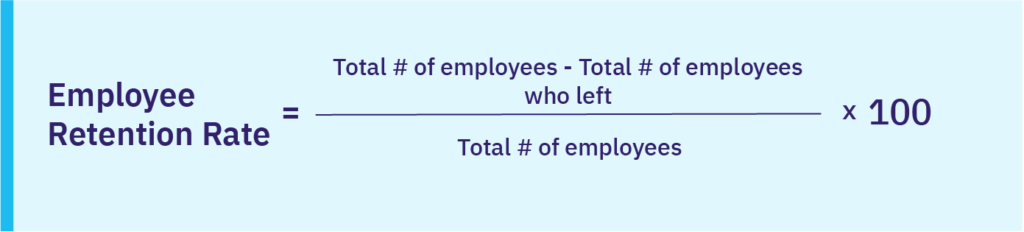
Review retention alongside turnover rather than in isolation, since a healthy organization-wide figure can obscure a single team that is losing experienced staff.
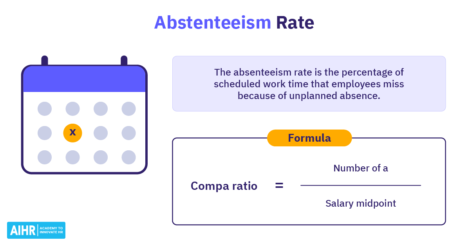
3. Absenteeism rate
What it signals: Level of unplanned absence across your workforce.
A high absenteeism rate can indicate poor working conditions, weak management, or burnout. It also has a compounding effect, as each absence increases colleagues’ workload and can raise their stress and job dissatisfaction.

Review absenteeism by team, location, shift pattern, and manager. Look for patterns before drawing conclusions. Sick-leave regulations differ by country, so account for these differences before comparing teams or regions.
Employee engagement metrics only become useful when HR knows how to interpret them and connect them to action. Building effective people data skills helps you move from tracking scores to understanding what employees need.
AIHR’s People Data & Business Insights Certificate Program teaches you to:
✅ Analyze and interpret HR data with more confidence
✅ Apply HR metrics frameworks to connect people data to strategy
✅ Build HR dashboards and reports in Excel and Power BI
✅ Turn engagement data into insights leaders can use
💡 Check out the lessons in AIHR’s Demo Portal for a clear idea of what you’ll get.
4. Employee Net Promoter Score (eNPS)
What it signals: How likely employees are to recommend your organization as a place to work.
Employee Net Promoter Score (eNPS) is one of the most widely used engagement metrics, usually measured through an engagement survey. It is based on a single question: on a scale of 0 to 10, how likely are you to recommend this organization as a place to work? Responses fall into three groups:
- Promoters: a score of 9 or 10, indicating satisfaction and strong engagement
- Passives: a score of 7 or 8, indicating a neutral view without advocacy
- Detractors: a score of 0 to 6, indicating dissatisfaction
To calculate your eNPS, the formula is:
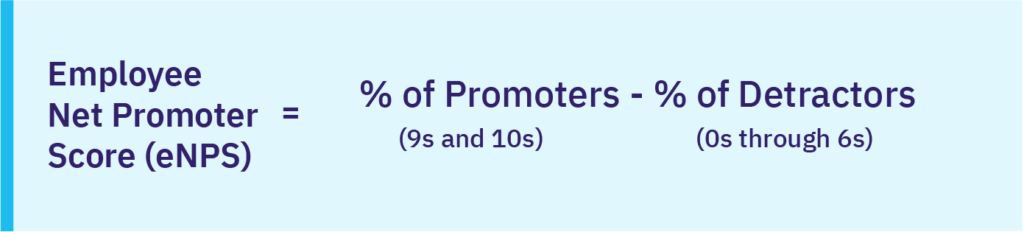
The score runs from −100 to +100.
Do not overreact to one score. Track eNPS over time and compare results across teams, locations, and employee groups. The trend will tell you more than one survey result.
5. Employee satisfaction
What it signals: How content employees are with their job conditions.
Employee satisfaction and employee engagement are connected, but they are not the same.
Employee satisfaction often reflects job conditions, such as pay, workload, benefits, flexibility, and manager support. Engagement is more about motivation, commitment, and connection to the organization’s goals.
A short employee satisfaction survey can help you measure this. Questions might include:
- Do you feel valued in your role?
- Do you feel that your job is allowing you to use your skills?
- Do you have a good relationship with your manager?
- Do you see a career path to advance your career within the organization?
- Do you feel the organization prioritizes your wellbeing?
Assign each question a theme, such as wellbeing or career development, so you can interpret responses by category.
6. Employee performance
What it signals: How well your people perform in their roles.
Engaged employees tend to bring more energy, focus, and commitment to their work. That is why performance data can help you spot engagement issues early.
You can group employee performance metrics into four areas:
- Work quality: Error rates, quality scores, or 360-degree feedback
- Work quantity: Units produced, cases closed, calls handled, or projects completed
- Work efficiency: Output compared with time, cost, or resources used
- Organizational impact: Revenue per employee, customer outcomes, or human capital ROI
Do not use performance data alone to judge engagement. A high performer may be close to burnout. A low performer may face unclear goals, poor tools, or weak manager support.
Review performance alongside engagement survey data, manager feedback, absence, and turnover. Together, these metrics give you a fuller picture.
HR tip: Try the employee engagement matrix
An employee engagement matrix is a simple framework for grouping employees, or teams, across two dimensions: their engagement level and their performance level. Plotting the two on a 2×2 grid creates four quadrants, each pointing to a different management response:
- High performance, high engagement: Recognize and retain these employees, and keep them challenged. High performance, low engagement: A flight risk, so focus on workload, recognition, and purpose before they disengage further. Low performance, high engagement: Support these employees with coaching, clearer expectations, or training. Low performance, low engagement: Investigate the cause, whether it is role fit, management, or motivation.
7. Glassdoor and employer review ratings
What it signals: How current and former employees describe your organization publicly.
Engagement directly affects your employer brand. What people say about you online reflects how they experience working for you, and most candidates check review sites before applying. That makes engagement an external concern as well as an internal one, since it shapes your ability to attract talent.
Glassdoor is the most established of these sites, rating employers on a 5-point scale based on employee feedback:
- 5: Very satisfied
- 4: Satisfied
- 3: OK
- 2: Dissatisfied
- 1: Very dissatisfied
The score combines these ratings with written reviews, and Glassdoor weights recent ones more heavily, so it reflects the current experience.
Treat the rating as one external signal alongside your internal metrics, and read the recurring themes in the written reviews rather than the headline score alone.
8. ROI on employee engagement
What it signals: The business return on your engagement work.
Engagement has a measurable link to financial performance. In Gallup’s Q12 meta-analysis, the most engaged teams outperform the least engaged on the outcomes leaders track, including 23% higher profitability and 18% higher sales productivity. Engagement is not the only factor behind these results, but the pattern holds across industries and countries.
To estimate your own ROI, weigh the cost of your engagement program against the savings from reduced turnover and the gains from higher productivity. The human capital ROI formula provides a starting point.
9. Customer satisfaction
What it signals: How engagement shows up in customer experience.
Engagement and customer satisfaction are closely linked, and the relationship runs in both directions. Employees shape every customer interaction, so disengaged or burnt-out staff find it harder to deliver the service that keeps customers loyal, while engaged employees tend to provide a better experience.
Read this metric in the context of the others. Customers can report high satisfaction even when employees are under strain, so balance customer scores such as CSAT against your internal engagement data.
10. Employee engagement score, index, and scales
What it signals: A single trackable number for overall employee engagement.
Many organizations consolidate survey data into a single composite engagement score, a weighted average of pulse-question responses converted to a 0 to 100 index. Questions typically cover themes such as manager-relationship, recognition, growth, and psychological safety.
Engagement score = weighted average of pulse question ratings, converted to a 0 to 100 index
Many organizations base their questions on validated instruments such as the Utrecht Work Engagement Scale (UWES) or Gallup’s Q12. To interpret your result, compare it against a current benchmark. Gallup’s State of the Global Workplace found that only 20% of employees worldwide were engaged last year, which gives you a global reference point, though your own trend over time tells you more.
Tools to measure employee engagement
Most of the data you need already lives in the tools you have. The job is less about buying new software and more about bringing your survey and behavioral data into one view. Three types of tools help you do that:
- Survey and pulse platforms capture the feeling side, your eNPS, satisfaction, and engagement scores.
- HR information systems (HRIS) hold the behavioral side, including your turnover, retention, and absenteeism figures.
- People analytics and business intelligence tools combine these sources so you can see survey scores alongside behavioral data.
You do not need an expensive platform to start. A well-structured spreadsheet, or an HR analytics dashboard in Excel or Power BI, is enough to track a handful of metrics and follow the trend. Add specialist tools as your needs grow.
Whatever you choose, a good engagement dashboard shows your headline metrics, the trend over time, and a breakdown by team, manager, location, and tenure. That breakdown is the most useful part, since a company-wide average can hide the one group that needs your attention.
Free employee engagement metrics template (PDF)
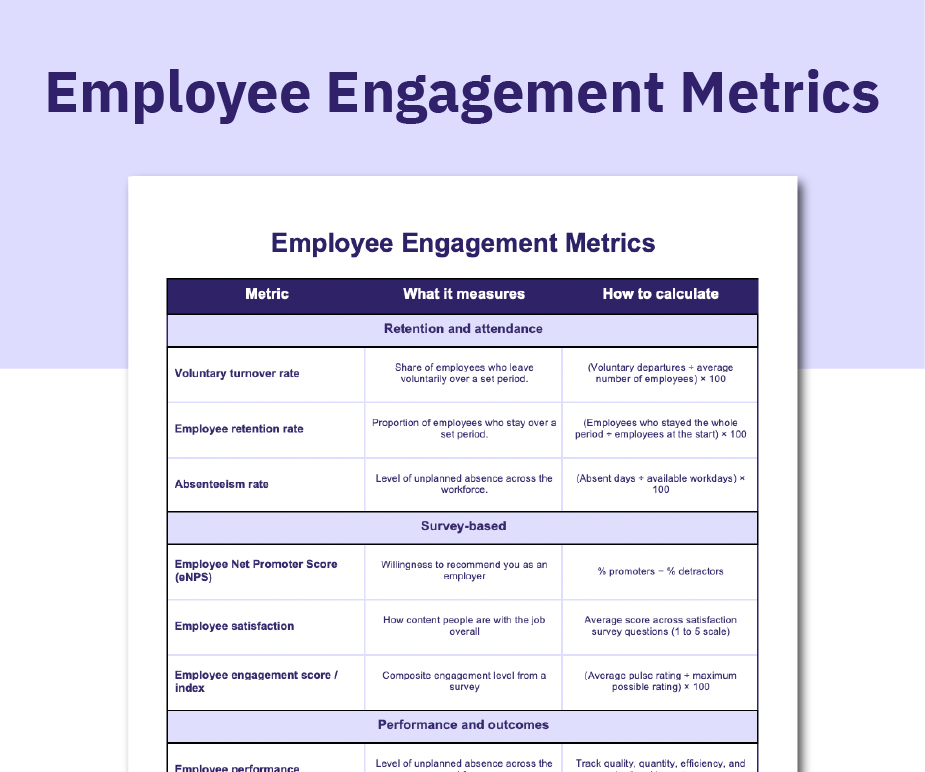
Our free employee engagement metrics PDF template puts these metrics in one place. For each one, you get the name, a short explanation, and the formula you need to measure it.
Over to you
Employee engagement metrics help you spot where employees need more support. Their value comes from turning those findings into action.
Start with three to five metrics linked to your current priority, such as turnover, absenteeism, or eNPS. Then segment the data by team, manager, location, and tenure to uncover patterns behind the numbers.
To build confidence with this work, explore AIHR’s People Data & Business Insights Certificate Program. You’ll learn how to analyze HR data, build dashboards, and turn engagement insights into recommendations leaders can use.