

Every workforce has some absences. People get sick, need to handle emergencies, and take the occasional mental health day. The absenteeism rate is the metric that tells you whether that absence sits within a healthy range or points to a deeper problem with engagement, workload, or management.
For HR teams, it’s one of the clearest early signals of organizational health, often climbing well before engagement scores dip or turnover spikes. This guide explains what the absenteeism rate is, how to calculate it, and what a healthy rate looks like by industry. You’ll also find a free calculator to help you run your own numbers.
Contents
What is an absenteeism rate?
Common causes of absenteeism
How to calculate an absenteeism rate
Absenteeism rate calculation examples
Absenteeism rate calculator [Free template]
What is a good absenteeism rate?
Average absenteeism rate by industry and sector
How to reduce a high absenteeism rate
Absenteeism rate metrics to track and report
FAQ
What is an absenteeism rate?
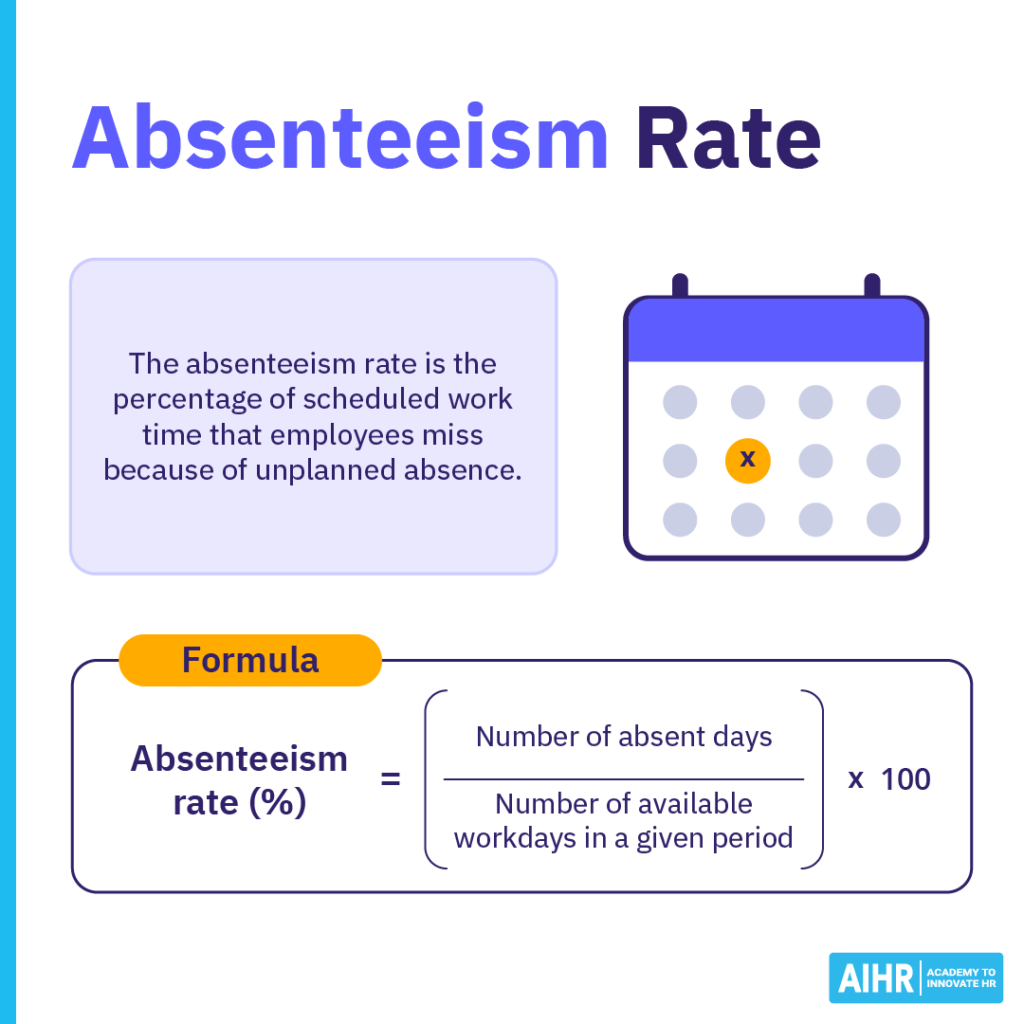
The absenteeism rate, absence rate, or absence percentage, is the percentage of scheduled work time that employees miss because of unplanned absence. You can calculate it for a set period, such as a month, quarter, or year, and measure it for an individual, a team, or the whole organization.
To understand the absence rate, you first need to understand what it measures. Being absent means any occasion or period when an employee is away from work. It’s driven by physical illness, stress-related illness, the occasional unauthorized absence, or other reasons, such as a parent staying home to care for a child. Holidays and lateness don’t count toward the rate.
Like employee turnover, high or persistent absenteeism can affect productivity, staffing, and team workload. Some absence is normal, but a sustained increase can point to underlying issues worth investigating.

Absenteeism rate vs. absence frequency
Absenteeism rate and absence frequency measure two different things. The rate tells you how much time is lost. The frequency tells you how often absences happen. Tracking both gives you a fuller picture than either number alone.
What it measures
How much scheduled time is lost (severity)
How often absences occur (pattern)
Question it answers
How much work time are we losing?
How often are people calling in?
Expressed as
A percentage of available workdays
A count of separate absence instances
Example at a 4% rate
One employee out for 10 days straight
One employee out 10 separate times, a day each
A high number often signals
Long-term illness or serious health issues
Stress, disengagement, or minor recurring issues
Common causes of absenteeism
Absenteeism can have many causes, so look for patterns before deciding how to respond. Common drivers include:
- Illness and injury: Short-term illness, injuries, chronic conditions, and medical treatment can lead to unplanned absence.
- Stress and burnout: Heavy workloads, long hours, and ongoing pressure can contribute to stress-related absence.
- Family and caregiving responsibilities: Employees may need unexpected time off to care for children, partners, parents, or other family members.
- Work environment and safety: Physically demanding work, poor ergonomics, or unsafe conditions can increase the risk of illness and injury.
- Scheduling and workload issues: Understaffing, unpredictable schedules, excessive overtime, and limited flexibility can make attendance harder to sustain.
- Management and employee experience: Poor manager relationships, conflict, low trust, or disengagement can contribute to repeated absence.
HR tip
Treat absenteeism as a signal, not a diagnosis. Combine absence data with engagement, workload, and manager feedback before taking action.
How to calculate absenteeism rate
Here are the key steps for calculating the absenteeism rate for any employee, team, or time period.
Step 1: Choose the time period and scope
Decide the period you want to measure, such as a month, quarter, or year, and whether you’re looking at one employee, a single team, or the whole organization. Keeping the period and scope consistent lets you compare results fairly over time.
Step 2: Gather the required data
You need two figures for that period. The first is the number of absent days, meaning total days of unplanned absence. The second is the number of available workdays, meaning the total days the person or group was scheduled to work. Your HRIS, time and attendance system, or payroll records are the usual sources. Count only unplanned absence, and leave out approved time off, such as vacation and public holidays.
Step 3: Apply the absenteeism rate formula
Once you have both numbers, calculate the rate using this formula:
Absenteeism rate = | Number of absent days | x 100 |
Number of available workdays in a given period |
This works for a single employee or a whole team. For a group, add up everyone’s absent days and everyone’s available workdays before you divide.
Step 4: Interpret the result
Compare the result against your own past rates and your industry benchmark. A rate that climbs over time, or sits well above your sector average, is the signal to look closer at frequency, specific departments, and root causes.
Absenteeism rate helps HR spot early signs of workload, wellbeing, engagement, or management issues. With stronger people data skills, you can move from calculating absence to understanding what the numbers mean.
AIHR’s People Data & Business Insights Certificate Program teaches you to:
✅ Analyze and interpret HR data with more confidence
✅ Apply HR metrics frameworks to connect people data to strategy
✅ Build HR dashboards and reports in Excel and Power BI
✅ Turn workforce data into insights leaders can use
💡 Check out the lessons in AIHR’s Demo Portal for a clear idea of what you’ll get.
Absenteeism rate calculation examples
Calculating employee absenteeism rate works the same way, whatever you measure. What changes is the scope and the length of the period.
Example 1: Team over a month
Over one month, a 10-person team logged 5 unplanned absence days. With 20 scheduled workdays in the period, the team had 200 available workdays in total.
5 ÷ 200 = 0.025
0.025 × 100 = 2.5%
The team’s absenteeism rate for the month is 2.5%. On its own, this is just a snapshot. Its value comes from tracking it month to month to see whether absence is stable, rising, or falling. To do that, run the same calculation each period:
Monthly absenteeism rate = | Number of absent days in the month | x 100 |
Number of scheduled workdays in the month |
Example 2: Department over a quarter
A 25-person department is scheduled for 60 workdays across the quarter, giving 1,500 available workdays. Over those three months, the department logged 60 unplanned absent days.
60 ÷ 1,500 = 0.04
0.04 × 100 = 4%
The department’s quarterly rate is 4%. A figure like this is worth pairing with absence frequency. If a few people account for most of the absence, the response is different than if short absences are spread across the whole team.
Example 3: Whole organization over a year
Across a full year, a 50-employee company had 13,000 available workdays, based on 260 scheduled days per person. Unplanned absence accounted for 390 of them.
390 ÷ 13,000 = 0.03
0.03 × 100 = 3%
The organization’s annual absenteeism rate is 3%. An organization-wide number hides a lot of variation, so break it down by department, location, or role to find where absence actually concentrates. To calculate it, use the same formula across the full year:
Annual absenteeism rate = | Number of absent days in the year | x 100 |
Number of scheduled workdays in the year |
Example 4: Organization on a single day
Some teams track a daily rate to monitor absence in real time. On a given day, a company has 200 employees scheduled to work, and six are absent due to unplanned sick leave. Because each employee represents one available workday that day, the calculation is:
6 ÷ 200 = 0.03
0.03 × 100 = 3%
The company’s absenteeism rate for that day is 3%. A daily rate is useful for catching sudden spikes, such as during flu season.
Free absenteeism rate calculator
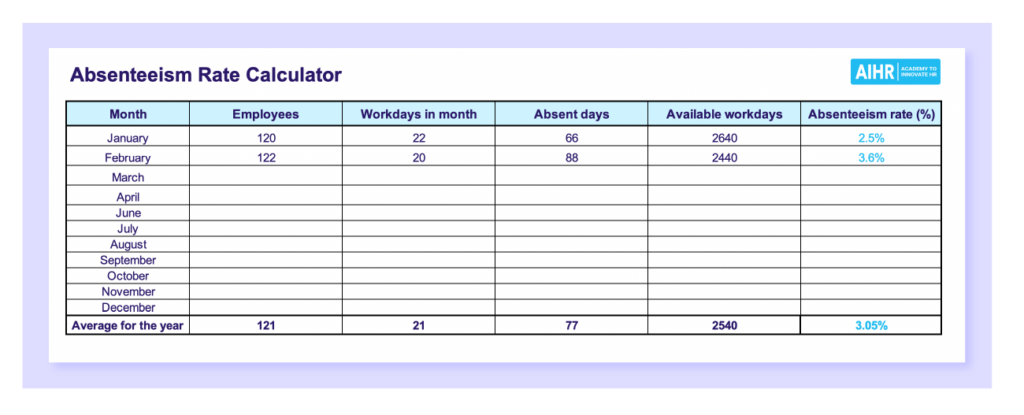
Running the formula by hand works for a single figure, but it gets tedious once you’re tracking several teams or checking the rate every month. To make it easier, we built a free absenteeism rate calculator in Excel that you can download and reuse.
Enter your scheduled workdays and absent days, and the spreadsheet automatically calculates the rate. It has separate tabs for monthly, quarterly, and yearly tracking, plus a by-department view to show where absence concentrates, so you can spot trends and problem areas as they build.
What is a good absenteeism rate?
What counts as a good or acceptable absenteeism rate varies, though the national average gives you something to measure against. The most recent Bureau of Labor Statistics data shows that U.S. employers lose about 1.7% of scheduled work time to unplanned absence.
Use it as a reference point rather than a goal to hit. A healthy rate also depends on your sector, your workforce, and your own history. A rate at or below your industry average that holds steady over time is generally a good sign. Because averages vary widely by sector, a like-for-like comparison is more useful than the national figure.
A rate becomes high, or a cause for concern, when it sits well above your industry benchmark or climbs steadily from one period to the next. That’s the signal to look closer at which teams, causes, and absence patterns are driving it.
Average absenteeism rate by industry and sector
Absence isn’t spread evenly across the economy. Rates vary across industries and parts of the public sector, so a like-for-like comparison gives you a more useful benchmark. The table below shows the share of work time lost to absence across selected industries and sectors, based on BLS Current Population Survey data for 2025.
All industries (national average)
1.7%
Federal government
2.6%
Public sector (overall)
2.2%
Health care and social assistance
2.1%
Local government
2.0%
Education and health services
1.9%
Retail trade
1.7%
Transportation and warehousing
1.7%
Manufacturing
1.6%
Information
1.6%
Leisure and hospitality
1.5%
Professional and business services
1.5%
Financial activities
1.4%
Construction
1.2%
Use your own industry as the benchmark. A rate that sits close to your sector figure and holds steady over time is a healthy sign, while one well above it is worth a closer look.
How to reduce a high absenteeism rate
A high absenteeism rate doesn’t always point to a workplace problem. Seasonal illness, temporary events, or normal variation can also cause short-term increases. But if the rate stays high or keeps rising, look for patterns that may signal issues with workload, wellbeing, flexibility, or management.
These six tips give you practical starting points:
- Offer flexible and remote work options: When people can work from home, a sick child or a mild cold no longer forces a full day of absence. A parent can cover care and still contribute, and an employee with a minor illness can keep working without passing it around the office. Flexibility turns many all-or-nothing absences into productive days.
- Set clear, supportive absence policies: Spell out how to report an absence, who to notify, and when to stay home versus work remotely. Clear guidance removes uncertainty and lets people make a sensible call, so they recover properly and come back ready to work.
- Train managers to handle absence well: Managers set the tone for how time off is reported and supported. Give them a simple, consistent process for logging it, checking in with care, and running return-to-work conversations. A supportive check-in helps people feel comfortable being honest about what they need.
- Provide health and wellbeing support: Access to occupational health services, an employee assistance program, or mental health resources helps people manage issues before they grow into extended absence. Proactive support also signals that the organization takes wellbeing seriously.
- Recognize and protect employee wellbeing: Reasonable workloads, adequate rest, and genuine time to recover keep small issues from becoming chronic ones. Some organizations reinforce this by recognizing healthy, well-supported teams, which builds a culture where wellbeing and attendance go hand in hand.
- Address the root causes in your culture: A persistently high rate often points to something deeper, such as burnout, disengagement, or management practices that need attention. Use your absenteeism data, broken down by team and pattern, to find where the problem concentrates, then start your response there.
Absenteeism rate metrics to track and report
Most organizations report absenteeism by team, department, or location. Breaking the rate down this way reveals pockets of high absence that an organization-wide number hides, so you can target support where it’s needed rather than across the whole business.
The absenteeism rate is the headline figure, but a few companion metrics give it context and help you measure it more precisely:
- Absence frequency: How often absences happen, counted as separate instances regardless of length. Many short absences and a few long ones call for different responses.
- Average absence duration: The typical length of an absence, in days. Read alongside frequency, it shows whether you’re dealing with brief, repeated absences or a few extended ones.
- Zero absence rate: The share of employees with no recorded absence during the period. Track it alongside other absence metrics, as a very high rate can also reflect presenteeism or employees feeling unable to take time off.
- Number of absence instances: The total count of separate absences across the group, useful for spotting trends over time.
- Total absence days: The raw number of days lost, which feeds directly into cost calculations.
- Absence cost: The financial impact of lost days, combining wages, lost productivity, and any cover or replacement costs.
Next steps
An absenteeism rate is most useful when you connect it to your other people metrics and turn the result into insight your leaders act on.
That’s the focus of AIHR’s People Data & Business Insights Certificate Program. You’ll learn to work with HR metrics, build dashboards in Excel and Power BI, and translate people data into clear business insight, including a hands-on module on data-driven absence reporting.
FAQ
In HR, the absenteeism rate is the percentage of scheduled work time that employees miss due to unplanned absence, such as sick days or no-shows. HR teams track it for an individual, a team, or the whole organization to gauge workforce health and catch problems with engagement, workload, or wellbeing early. It’s also known as the absence rate.
Divide the number of absent days by the number of available workdays in a given period, then multiply by 100. You can run it for any timeframe, such as a month, a quarter, or a full year, as long as both figures cover the same period. For example, an employee absent 1 day out of 20 scheduled workdays has a monthly absenteeism rate of 5%. The same formula works for a team or the whole organization once you total the absent days and available workdays.
There’s no single normal figure, but U.S. employers lose about 1.7% of scheduled work time to unplanned absence, according to the most recent Bureau of Labor Statistics data. What counts as normal for you depends on your industry, so compare against your sector rather than the national average. A rate that stays close to your industry figure and holds steady over time is generally healthy.
A 10% absenteeism rate means employees miss 10% of their scheduled work time. For one person, that works out to roughly 1 absent day in every 10 workdays, or about 2 days in a typical 20-day month. That sits well above the U.S. average, so a rate holding at this level signals a problem worth investigating.