
Building an HR analytics dashboard in an AI tool can help you move faster from reporting to decision-making, but the tool alone isn’t enough. Recent HR research found that 88% of HR leaders say their organizations have not realized significant business value from AI tools.
The challenge is to use AI in a way that saves time without compromising decision quality. A basic HR dashboard gives you a manageable place to start. With clean data, relevant KPIs, a clear business question, and human oversight, you can turn raw workforce data into insights leaders can actually use. This article looks at how you can achieve this with AI, and what to do to get the best results.
Contents
Why use AI to build your HR analytics dashboard
What you need before you start building an HR dashboard with AI
4 steps to build a basic HR analytics dashboard
How to interpret and share your AI-built HR analytics dashboard
Key takeaways
- AI can help HR teams build dashboards faster by reducing manual work such as cleaning spreadsheets, fixing formulas, and creating first-draft visuals.
- A useful HR dashboard starts with a clear business question, clean data, and three to six relevant KPIs that support better decisions.
- HR professionals still need strong data literacy. AI can support HR reporting, but people must check the calculations, context, and interpretation.
- The goal is to build a working dashboard that stakeholders can use, then refine it based on their feedback and the decisions it helps them make.
Why use AI to build your HR analytics dashboard
Building an HR analytics dashboard the traditional way can be slow and manual. You often need to pull data from payroll, your HRIS), (ATS), LMS, and performance tools. Then, you’ll likely spend hours exporting CSVs, cleaning fields, running VLOOKUPs, fixing date formats, and rebuilding charts when the data changes.
By the time your HR reporting pack is ready, some of the numbers may already be out of date, as attrition, headcount, absence, and hiring patterns can change quickly. AI can reduce the spreadsheet work that slows HR reporting.
Generative AI assistants and natural-language BI features are now built into platforms such as Microsoft Copilot in Power BI, Power BI Q&A, and Tableau Pulse. These tools can help you ask questions about data, generate visuals, and surface trends without manually building every chart from scratch.
Instead of spending hours formatting spreadsheets, you can use AI to clean data, suggest layouts, spot unusual changes, and draft short explanations for leaders. For example, an HRBP could ask: “Show voluntary turnover by department over the past six months and highlight unusual changes.” The dashboard can then support a focused conversation with the manager.
The need for faster workforce decisions is also showing up in HR research, with 70% of business leaders saying their main competitive strategy over the next three years is to be fast and nimble. This puts pressure on HR to move beyond static reporting.
It’s important to remember that while AI makes dashboard-building less technical, it doesn’t remove the need for judgment. You still own the question, the KPIs, the data definitions, and the interpretation. This means checking source data for accuracy and relevance.

What you need before you start creating an HR dashboard with AI
Before you ask an AI tool to build an HR dashboard, get the basics right. AI can help with HR data visualization, layout ideas, formulas, and first-draft summaries, but it can’t replace HR judgment. You still need to know what the data means, where it came from, and whether the output makes sense.
Data literacy
For dashboard work, data literacy is now a core HR skill. It means being able to read HR reports, understand metrics, question unusual results, and explain insights in a way managers can act on. AI may speed up the build, but you still need to check the logic, validate the numbers, and challenge anything that looks wrong.
Human in the loop
AI can make mistakes. It can misread columns, apply the wrong formula, overlook missing values, or create a chart that looks polished but answers the wrong question. A human should always stay in control of the question, the dataset, the KPI definitions, and the final interpretation.
Specific AI tool/platform
Before you build, decide which AI tool you’ll use. Claude, ChatGPT, Microsoft Copilot, and other tools can all support dashboard preparation in different ways. Claude for HR can support document-heavy HR tasks and connected workflows. That can be useful when you want help drafting summaries, structuring reports, or preparing people analytics outputs. But you still need to check whether the tool fits your data environment and privacy rules.
The right place for your dashboard
Next, decide where stakeholders will view the dashboard. Claude can produce a clean-looking dashboard inside Claude, but that may not work if leaders need access in Power BI, Tableau, Excel, or another reporting environment. The best tool is the one that gives the right people access to the right view in the right place.
What to include in your dashboard
Then decide what to include. Many AI tools are now based on token use, which means how much information the tool has to read and generate. The more preparation you do before prompting, the better use you can make of those tokens. Clean the data first, clarify the business question, and decide what you want the dashboard to show. Then select the data and visuals that support that question. If you need a starting point, use examples of different dashboard layers to choose the view that best fits your use case.
Privacy best practices
Set a privacy rule before uploading anything. Don’t paste identifying employee data into a public-tier AI tool. Use anonymized samples or work inside an approved enterprise account with the right data protection controls.
Data cleaning
Finally, collect and clean the datasets you need. This could include exports from your HRIS, ATS, payroll system, engagement platform, or LMS, in CSV or Excel format. Remove duplicate records, standardize date formats, check for missing values, and ensure that department names, job levels, and employee IDs are consistent.
Keep the first dashboard focused. Choose three to six relevant KPIs, such as turnover, absence, time to fill, internal mobility, or engagement scores. If you need a starting point, use proven metric sets and dashboard examples to choose the measures that fit your use case.
This planning strengthens the people analytics skills behind credible dashboard work, including preparing and using HR data and building a strong analytics foundation. In practice, this is what makes an AI-built dashboard credible: clean data, clear questions, and HR oversight from start to finish.
AI can help you create a basic HR dashboard without coding, but the real value comes from knowing which metrics matter and how to turn them into clear business insights.
AIHR’s People Data & Business Insights Certificate Program will help you:
✅ Identify the HR metrics and KPIs that connect people data to business priorities
✅ Prepare and analyze HR data to uncover workforce trends and patterns
✅ Build clear dashboards and reports in Microsoft Excel and Power BI
✅ Translate dashboard insights into practical recommendations for stakeholders
Check out the lessons in AIHR’s Demo Portal for a clear idea of what you’ll get.
4 steps to build a basic HR dashboard with AI
You don’t need to build a perfect HR dashboard in one session. The aim is to create a working version that helps HR and business stakeholders see what’s happening, ask better questions, identify early warning signs, and decide what to improve next.
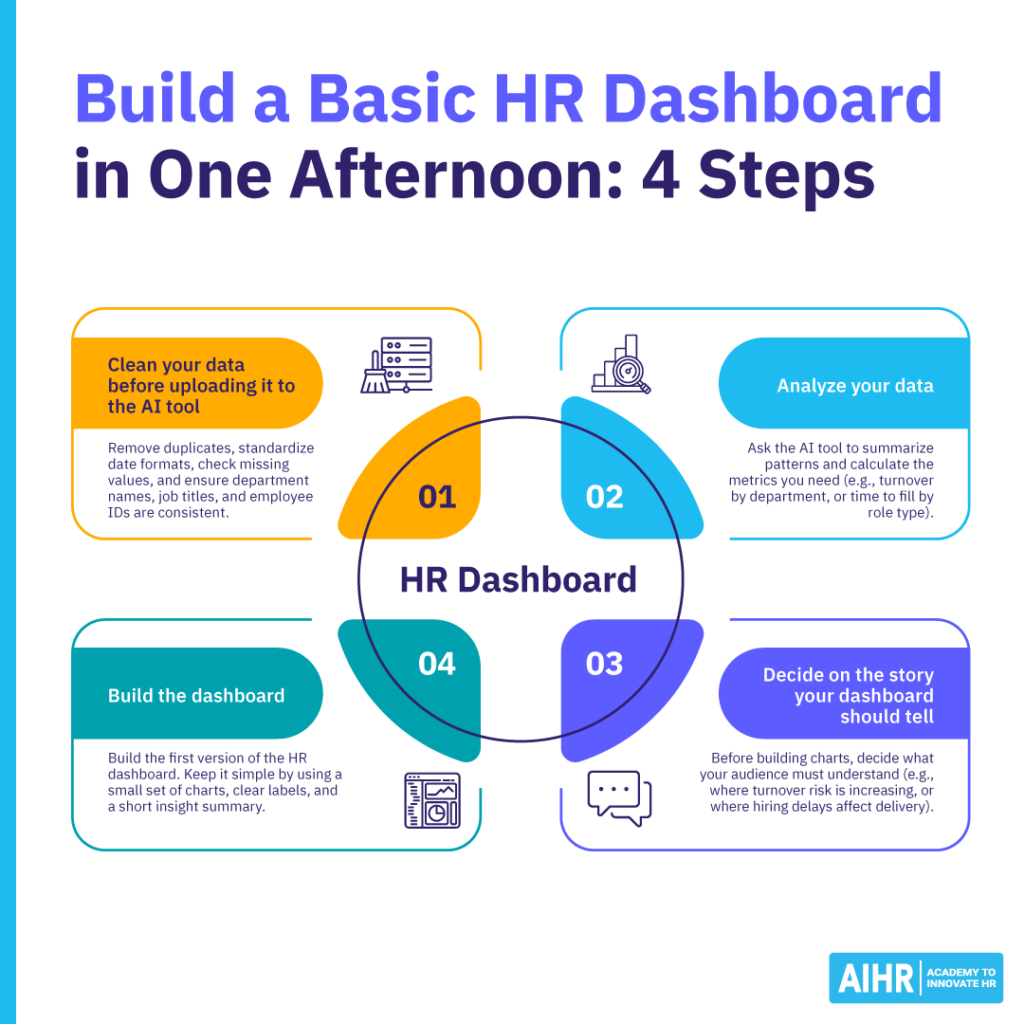
To keep the process manageable, break the work into four practical stages: cleaning your data, analyzing it, shaping the story, and building the dashboard. The same structure works well when using AI tools for HR.
Step 1: Clean your data before uploading it to the AI tool
Start with a clean CSV or Excel file. Remove duplicates, standardize date formats, check missing values, and make sure department names, job titles, and employee IDs are consistent. HR AI tools can help spot issues, but they need a well-prepared file to produce useful HR data visualization.
Prompt
“You’re an HR data analyst reviewing a dataset before dashboard creation. Review the attached HR dataset for data quality issues that could affect analysis or visualization.
Check for:
- Duplicate rows
- Missing or blank values
- Inconsistent department names
- Inconsistent job titles
- Inconsistent or invalid date formats
- Impossible values (e.g. negative tenure, hire dates in the future)
- Outliers
- Fields too inconsistent to group or filter reliably.
Rules:
- Quantify each issue where you can (e.g. ’12 of 480 rows have blank termination dates’).
- Do not infer or fill in missing data.
- Do not calculate any KPIs.
- If a column’s meaning is ambiguous, list it as an open question rather than guessing.
Return:
- A summary of the main data quality risks, ranked by how much they’d distort analysis.
- A table with columns: issue, affected column(s), number of rows affected, why it matters, and suggested fix.
- A checklist of what to fix before analysis.”
Step 2: Analyze your data
Once the dataset is ready, ask the AI tool to summarize patterns and calculate the metrics you need. This could include turnover by department, absence by team, headcount by location, or time to fill by role type. In one compensation benchmarking test, Claude helped structure the analysis, but some figures were inaccurate and needed validation. That’s why HR still needs to check the output before using it.
Prompt
“You’re an HR analytics partner preparing a first-draft analysis. Using only the data present in the attached file, calculate these metrics broken down by department:
- Headcount
- Voluntary turnover rate
- Average tenure
- Absence rate
- Time to fill.
- For each metric, state:
- The exact formula
- The columns used
- The date range or period it covers
- Any assumptions.
Rules:
- Do not estimate or fabricate any figure. If the data needed for a metric is missing or unreliable, say so and skip it rather than approximating.
Flag any result that looks unusual, any large gap between departments, and any figure you’d recommend a human validate before it’s shown to leadership. - Show your calculations clearly enough that I can reproduce them.
- Keep explanations practical for HR leaders.”
Step 3: Decide the story your dashboard should tell
A dashboard should guide attention. Before building charts, decide what the audience needs to understand. For example, an HRBP may need to show where turnover risk is increasing, while a recruitment lead may need to show where hiring delays are affecting delivery.
Prompt
“You’re helping me turn this HR analysis into a clear dashboard narrative for an HR leadership audience. Based only on the figures in the analysis above, identify:
- The single primary insight leaders should see first, and why it matters.
- Two to three supporting insights.
- The best chart type for each insight, with a one-line reason.
- Caveats or context leaders need before acting, including any figures still pending validation.
- One suggested action or follow-up question per insight.
Rules:
- Distinguish clearly between what the data shows and what it only suggests.
- Don’t overstate certainty where the sample is small or the data was flagged as weak.
- Focus on decisions, not reporting.”
Step 4: Build the dashboard
Now build the first version of the HR dashboard. Keep it simple. Use a small set of charts, clear labels, and a short insight summary. Depending on your tools, you can ask the AI to generate a dashboard layout for Excel, Power BI, Tableau, or another reporting environment.
Prompt
“You’re designing a simple HR dashboard for a monthly leadership review. Using the dataset and the agreed story, propose a layout with 4 to 6 visuals. Include:
- KPI cards for the most important metrics, with the field and calculation behind each.
- Chart types and titles for each visual.
- The specific fields each visual draws on.
- A recommended top-to-bottom layout, with the primary insight placed first.
- Filters or slicers leaders should have (e.g., department, location, time period).
- A short plain-language summary covering what changed, why it matters, and what HR should look at next.
Rules:
- I’m building this in [Excel / Power BI / Tableau – specify which], so give layout and formula guidance specific to that tool.
- Avoid clutter.
- Explain any technical terms in plain language.”
The best first dashboard is practical. It gives stakeholders a clear view of the most important changes, supports regular HR reporting, and helps the team decide what needs a closer look. From there, HR can investigate the drivers behind the numbers and agree on the next action with the business.
How to interpret and share your AI-built HR dashboard
An HR analytics dashboard earns its keep when it changes what someone does next. Before sharing an AI-built people analytics dashboard, run four checks: accuracy, context, bias, and action.
Accuracy
Spot-check at least one KPI manually. If the AI tool calculated turnover, absence, or time-to-fill, test the formula against a small sample of the data. If the AI wrote the formula, HR still owns the result. You need to know how the number was calculated, what data was included, and whether the result is reliable enough to share with the business.
Context
Compare each number against last quarter, last year, or a relevant external benchmark. A 10% turnover rate means very little on its own. It becomes useful when leaders can see whether it’s rising, falling, above the company norm, or concentrated in one part of the business.
Bias
Break key metrics down by gender, tenure, location, and role family where it’s appropriate and legally allowed. An AI tool may highlight the biggest overall pattern while missing smaller differences that need attention. For example, an employee performance dashboard may look healthy at the company level, but still show lower promotion rates for one employee group when you break the data down by gender, tenure, location, or role family.
Action
For every chart, ask: “What would I do differently if this number doubled?” If the answer is unclear, the chart probably doesn’t belong on the HR metrics dashboard. Every visual should help stakeholders understand what needs attention or what action to consider next.
When you share the dashboard, add a short narrative wrapper. This could be a single slide, a 2-minute Loom, or a Teams message that explains what changed, why it matters, and what HR recommends next. This gives non-analyst stakeholders enough context to act on the data instead of trying to interpret the dashboard on their own.
It also connects the dashboard to the wider people analytics process and builds the storytelling skills HR needs to turn insights into action.
Next steps
Choose one HR reporting problem that takes too long (e.g., monthly turnover reporting, recruitment pipeline updates, absence tracking). Then assess which AI tools your organization already uses. Does it have access to Microsoft Copilot in Power BI, Google Workspace with Gemini, Tableau, or an approved enterprise AI account? Check how well the tool connects with your HR systems, who can access the dashboard, and what data privacy controls are in place.
From there, build one basic dashboard, test it with stakeholders, gather feedback, and refine it based on what helps them make better decisions. Then take the next step with AIHR’s People Analytics Certificate Program to help you turn workforce data into useful decisions.