

Payroll metrics help you see where pay problems start and how well your payroll process is working. A global study by the ADP Research Institute found that 40% of workers reported being paid incorrectly sometimes, often, or always.
Tracking payroll metrics gives you a practical way to catch errors early, test fixes, and build a clearer case for better tools, processes, or payroll support. This article explains what payroll metrics are and why they matter, which ones to track, how to build a payroll metrics dashboard, and which best practices to follow to ensure a smooth, efficient payroll process.
Contents
What payroll metrics are and why they matter
15 payroll metrics and KPI examples to track
How to build a payroll metrics dashboard
5 payroll metrics best practices to follow
What payroll metrics are and why they matter
Payroll metrics are measurable data points HR teams use to track payroll performance. They help you compare results across pay periods, locations, teams, or providers. They also show where the process needs attention.
HR and payroll teams often use “payroll metrics” and “payroll KPIs” interchangeably. But while they’re related, they’re not identical. A metric is a measurement, such as payroll cost per employee. A KPI links that measurement to a goal, such as reducing payroll cost per employee by 5% this year.
For HR professionals, these measures show how accurate, efficient, and reliable payroll is. Accuracy metrics uncover repeated mistakes that can create compliance risk, while cost metrics show where manual work and corrections add to costs, and processing metrics flag delays before employees have to wait for pay.
Many organizations still don’t track payroll performance. According to a PayrollOrg survey, 38% of respondents didn’t measure it, leaving only 62% who did. Without clear measures, HR has less visibility into errors, delays, and avoidable costs.

15 payroll metrics and KPI examples to track
Start with metrics that answer a clear question: Is payroll accurate, cost-effective, timely, and trusted by employees? The 15 examples below help you cover those areas without flooding your dashboard.
Accuracy and compliance metrics
1. Payroll accuracy rate
Payroll accuracy rate shows the percentage of payroll runs completed without errors. Divide accurate runs by total runs and multiply by 100. If 196 out of 200 payroll runs are accurate, your payroll accuracy rate is 98%. When the rate drops below target, tag each error by its source and assign an owner. If one source keeps causing errors, fix that part of the process before the next run.
2. Error rate per pay period
Error rate per pay period shows the percentage of employee payments with an error. As an example, if 18 out of 1,200 payments contain errors, the error rate is 1.5%. Track the error types too. If incorrect overtime makes up 10 of those 18 errors, ask the approving managers to fix the handoff before the next cutoff.
3. Payroll compliance score
A payroll compliance score measures performance against your organization’s compliance checklist. For instance, if the team passes 47 of 50 checks covering tax withholding, recordkeeping, and payment deadlines, the score is 94%. Assign each failed check to an owner with a correction date. A PayrollOrg survey found that 57% of respondents ranked local compliance as their biggest global payroll challenge.
4. Time to resolve payroll errors
Time to resolve payroll errors measures the time from when an error is reported to when payroll corrects it. If six errors take a total of 30 working hours to resolve, for example, the average is five hours. Set an escalation point for urgent cases. If an underpayment remains unresolved after four working hours, the payroll lead should address any approval delays or arrange an emergency payment.
5. First-time approval rate
First-time approval rate shows the percentage of payroll runs approved on the first submission. If reviewers approve 22 of 24 runs on the first try, for instance, the rate is 91.7%.
If the two rejected runs were missing approved new hire data, add that field to the pre-submission checklist. Then assign someone to confirm the data before submission. Compliance requirements vary by state or region, so consult a qualified payroll or legal professional about the rules that apply in each location.
Understanding payroll metrics helps you make informed C&B decisions. Build the skills you need to interpret workforce and rewards data, and connect those numbers to broader business and employee outcomes.
AIHR’s Compensation & Benefits Certificate Program will teach you how to:
✅ Identify and interpret key compensation and benefits metrics and data types
✅ Use benchmarking and analytics to inform your compensation strategy
✅ Analyze base pay and total rewards data to support evidence-based decisions
✅ Interpret pay gap data, identify key drivers, and translate findings into action
💡 Visit the AIHR Demo Portal to preview lessons and discover what you can learn with AIHR.
Cost and efficiency metrics
Use these payroll KPIs to show what it costs to deliver payroll and where avoidable work is pushing costs up.
6. Cost of payroll
Cost of payroll refers to the expense of running the payroll function. It doesn’t include the organization’s total wage bill. Include payroll staff, software, and outsourcing costs.
For example, if annual payroll operating costs are $240,000 and revenue is $12 million, payroll costs equal 2% of revenue. If the percentage rises, separate system fees from correction work. This helps HR see if the increase reflects business growth or a process problem.
7. Cost per payroll run
Cost per payroll run shows how much each payroll cycle costs. To calculate it, divide total payroll operating costs by the number of runs. For instance, annual costs of $156,000 across 26 runs equal $6,000 per run. Compare payrolls for similarly sized units. If one unit costs $1,500 more per run, review the manual steps and provider charges before changing the process or service agreement.
8. Time to process payroll
Time to process payroll measures the working days needed for each payroll cycle. Count the days for each cycle, then calculate the average. For example, if 12 monthly cycles take a combined 60 days, the average is five days per cycle. If processing time rises to six days, measure each stage. If late attendance data adds a day, set an earlier submission deadline with the relevant managers.
9. Overtime cost as a share of total payroll
Overtime cost as a share of total payroll shows how much overtime contributes to gross payroll cost. Divide overtime cost by gross payroll and multiply by 100. If overtime costs $90,000 and gross payroll is $3 million, overtime equals 3% of total payroll. Then, compare the result with the planned overtime by department. If one team exceeds the plan for two pay periods, review vacancies and shift schedules with the manager.
10. Payroll automation rate
Payroll automation rate shows the percentage of payroll transactions your system completes without manual work. If the system automates 8,400 of 10,000 transactions, the rate is 84%. Group the remaining 1,600 transactions by task. If 700 are routine data transfers, test automation, and compare the error rate before and after the change.
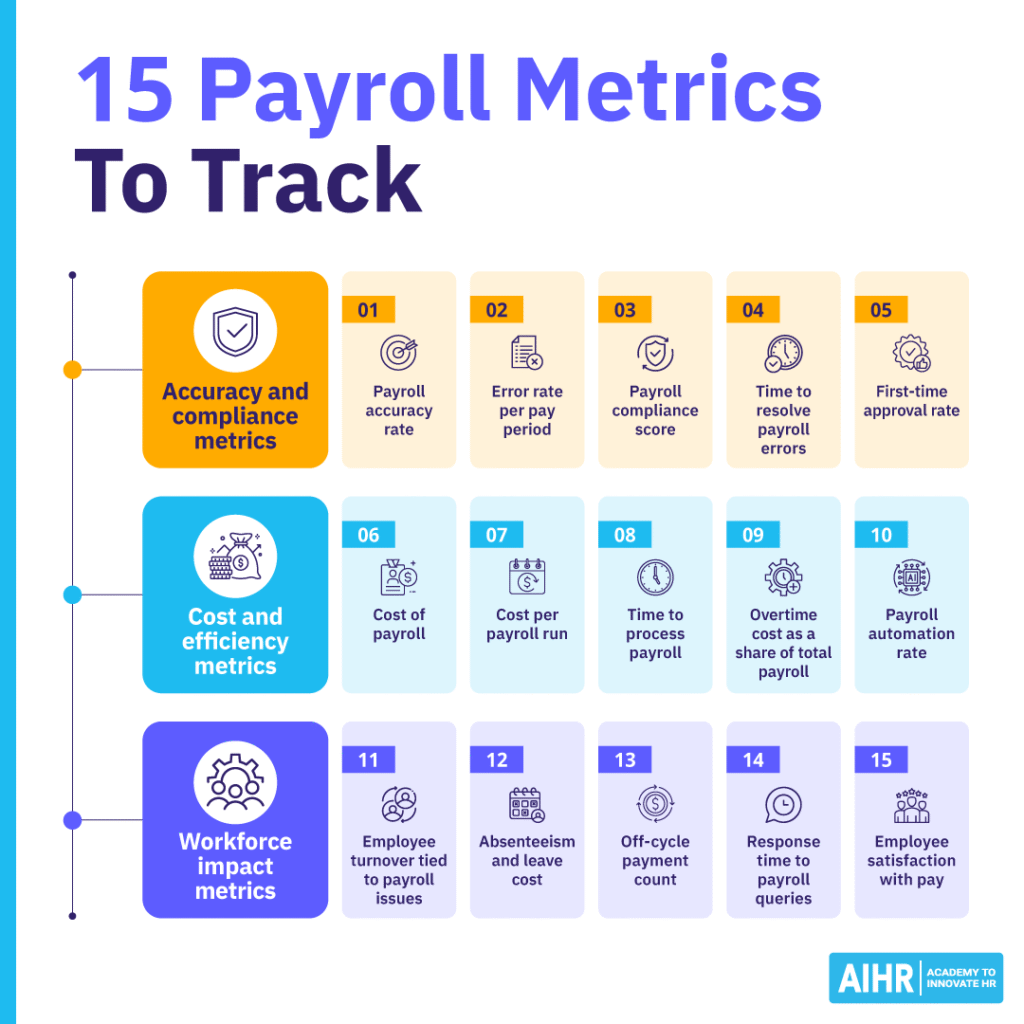
Workforce impact metrics
Payroll errors can damage employee trust and add work for HR. According to Remote’s State of Payroll Report, 32% of employees who had experienced a payroll mistake said it made them more cautious of their employer or reduced their trust. This is why payroll should be treated as a people-centered HR function, not just an administrative process.
11. Employee turnover tied to payroll issues
This metric tracks how many employees cite pay errors or delays when they resign. If 8 of 80 voluntary departures mention payroll problems, payroll issues show up in 10% of departures. Use the same payroll question in every exit interview. If six of the eight cases involve late payments in one location, investigate that payroll process first.
12. Absenteeism and leave cost
Absenteeism and leave cost uses payroll and attendance data to price the working time lost to absence or paid leave. If employees record 320 absence hours in a month and the average hourly employment cost is $35, the monthly cost is $11,200. Track the figures over time and across departments. A sustained increase can help HR spot patterns and investigate the causes of absence more closely.
13. Off-cycle payment count
Off-cycle payments fall outside the regular payroll run, and often correct errors or late information. If you make 17 off-cycle payments in a month against 2,000 regular payments, the off-cycle rate is 0.85%. Give each payment a reason code. If late information causes the delay, identify the teams involved. Then check if they’re missing the deadline or if the deadline needs to change.
14. Response time to payroll queries
Response time measures how quickly employees receive an initial reply to a payroll question. It doesn’t include the time needed to resolve the query. If 32 queries take a combined 96 working hours to answer, the average response time is three hours. Set a response target and track breaches. If half the late replies concern deductions, explain them more clearly on the payslip or self-service portal, then check if query volumes fall.
15. Employee satisfaction with pay
Employee satisfaction with pay measures how employees experience payroll accuracy, clarity, and support. You can use a survey question or helpdesk data. If 300 employees give their payroll experience an average score of 4.1 out of 5, you have a baseline.
To assess payroll performance, ask about accuracy and clarity rather than salary levels. If the payslip clarity score is only 3.2 out of 5, revise the layout or simplify how you explain deductions. Then repeat the question.
How to build a payroll metrics dashboard
A payroll metrics dashboard puts current payroll results on one screen. It replaces scattered spreadsheets, manual updates, and one-off reports. When each result appears next to its target, you can see what needs attention without reconciling several reports.
- Select four to six metrics that support your current goals: If reducing errors is your priority, start with payroll accuracy rate, error rate, and resolution time. Give each metric a target and assign an owner to investigate missed results.
- Connect to your payroll system or HRIS: Map each metric to its source field and automate updates where possible. The owner should still check that totals reconcile before HR reports the result.
- Set a review cadence: Review accuracy and off-cycle payments after every pay period, and review cost metrics monthly. Set alerts for thresholds that need action before the next scheduled meeting.
A completed dashboard might show payroll accuracy at 98% against a 99% target, as well as cost per employee at $480 against a $500 limit and average processing time at five days against a four-day target. On one screen, HR can see that cost is within range, while accuracy and processing time need follow-up.
Most payroll and HRIS platforms include built-in reporting, so look for reports that let you choose metrics, set alerts, and export dashboards for finance or senior leaders.
Payroll metrics best practices to follow
Apply these practices before you publish or discuss payroll results:
Tie each metric to a business goal
Without a target, a metric doesn’t show if performance is acceptable, so be sure to set the goal before reporting. For example, you could aim to raise payroll accuracy from 97% to 99% within six months. Record the baseline and deadline, then assign an owner to act if progress stalls.
Separate processing from reporting
For stronger internal control, the person running payroll shouldn’t be solely responsible for reporting accuracy. Ask an HR Analyst or colleague in finance outside the processing chain to pull or verify data. This makes any errors and manipulation harder to hide.
Check source data before reporting
A metric can be calculated correctly and still be wrong if the input data is incomplete. Reconcile the payroll register with the general ledger and bank statement, then check time and attendance figures. Keep a simple data map showing which system and field feed each measure.
Benchmark against recent performance first
Start with the last four to six pay periods, as this history shows you if performance has been improving or drifting. External benchmarks can help, but differences in industry, workforce size, and country can make direct comparisons misleading.
Audit calculation methods
Calculation methods and source fields can change, which makes results harder to compare across periods. Review each calculation quarterly or at year-end, and keep a dated record of any change. Bear in mind that this review is separate from a payroll audit and helps you compare the same measure over time.
Next steps
Start with four to six payroll metrics that match your current priorities. Set clear targets, review dates, and one owner for follow-up. Once the data is reliable and the team is acting on it, add new measures only when they answer a question your dashboard doesn’t yet cover.
Building payroll metrics into your HR skill set helps you work more effectively with payroll, finance, and business leaders. AIHR’s Compensation & Benefits Certificate Program helps you strengthen the pay and benefits knowledge behind payroll metrics, so you can analyze compensation data, ask better questions, and support more accurate pay decisions.