

Using Claude for Excel can be a game-changer for HR professionals. No more rebuilding the same turnover report every month, or struggling to navigate reporting without a wealth of formula or data skills.
“It reads your actual cells, writes the formulas directly, and builds the dashboard inside your spreadsheet. No copy-pasting, no broken formulas from a chatbot that can’t see your data,” write Ashwin Francis and Raghav Mehra, in a recent AI-focused journal on Substack.
The biggest benefit of Claude for Excel is that it’s an add-in that lets you stay inside the workbook and ask as many questions as you need of your people data to make sense of it.
In this article, we’ll explore how HR teams can benefit from using Claude for Excel, and how to begin using it for HR analytics.
Contents
What is Claude in Excel?
Why HR teams use Claude for Excel
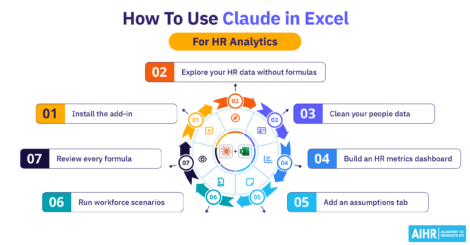
How to use Claude in Excel for HR analytics: 7 steps
What is Claude in Excel?
Claude for Excel is an add-in from Anthropic that opens as a sidebar while you’re still using Excel. It can read the entire workbook, including all tabs and formulas, and answer questions with references to the cells it has used to reach its answers. It can make changes (e.g., creating a new tab, adding a formula, creating pivot tables and charts) but it will always ask for approval before making an edit.
Claude for Excel is available to anyone with a paid Claude plan and currently works with Excel on the web and on Windows and Mac.

Why HR teams use Claude for Excel
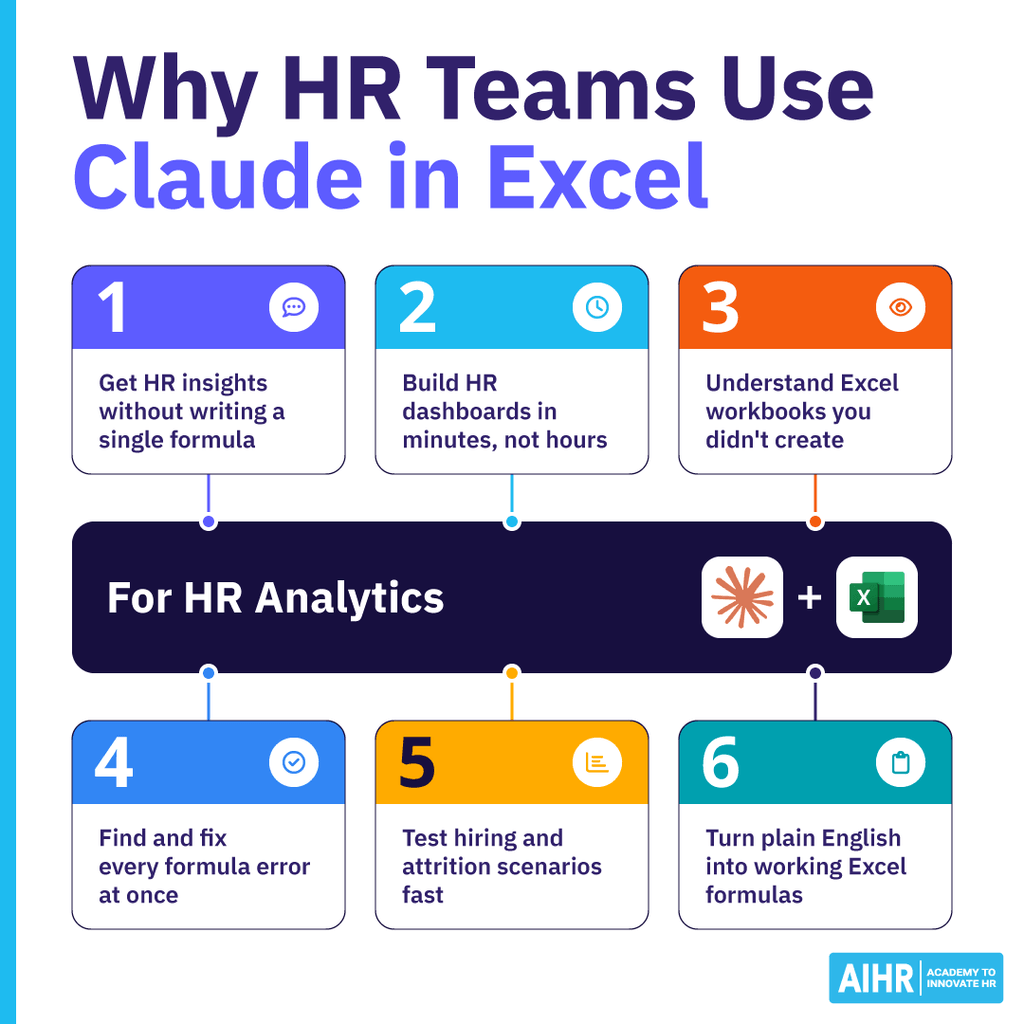
Here are some of the benefits HR teams can make use of with Claude for Excel:
- Create visualizations without formulas: Ask Claude questions such as, “Where is turnover highest?” and receive answers fast, in plain language, and in a form of your choice.
- Faster reporting and planning: Rebuild a monthly HR dashboard or test out a hiring strategy in minutes instead of hours.
- Understand workbooks you haven’t built: Claude can explain how different tabs connect by reading everything, then mapping the data flow.
- Identify and fix formula errors: Claude can identify all the affected cells at once and offer you a choice of how to fix them.
- Run various scenarios: Change an assumption to see how it impacts different departments and calculations, and have Claude summarize the key shifts.
- Build helpful formulas: You describe what you want to calculate, and Claude can write formulas that reference the right cells and stay connected to your assumptions, so you don’t have to manually update static values.
How to use Claude in Excel for HR analytics: 7 steps
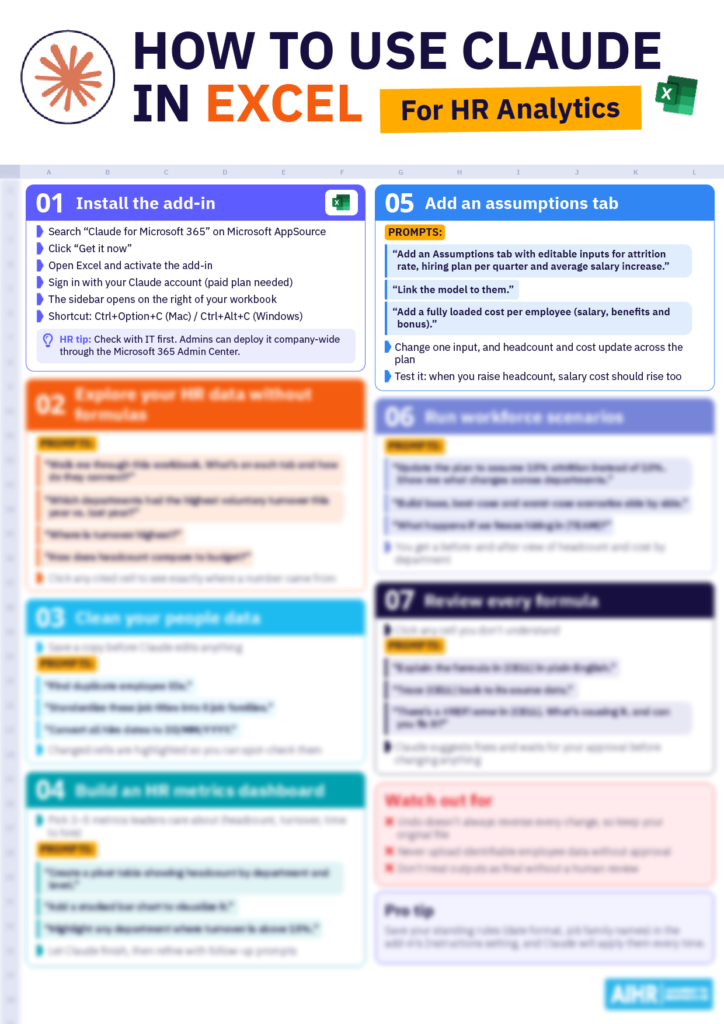
Step 1: Install the Claude for Excel add-in
In order to install the Claude for Excel add-in, you must have a paid Claude plan, and a supported version of Excel (web, Windows or Mac). Go to the Claude for Microsoft 365 listing on Microsoft AppSource, select “Get it now” to install. Finally, open Excel, activate the add-in, and sign in with your Claude account.
The expected output: The Claude sidebar opens on the right side of the Excel workbook, ready for you to ask a question. You can also open it with the following shortcuts: Ctrl+Option+C (Mac) or Ctrl+Alt+C (Windows).
HR tip: Check with your IT department before installing, as they need to approve any tool that uses employee data. Organization admins can deploy Claude for Excel through the Microsoft 365 Admin Center for the whole company.
Look out for: At the moment, the Excel add-in is available for all paid Claude plans (Pro, Max, Team, and Enterprise). However, it won’t work on certain older versions of Excel.
Step 2: Explore your HR data without formulas
Open an anonymized HR export (e.g., headcount, leavers or absence) in Excel. Ask Claude to explain how the workbook is set up before asking anything else. Next, ask business questions in clear, simple English, such as, “Where is turnover highest?” or “How does the headcount compare to the budget?”
Example prompt: “Walk me through this workbook. What’s on each tab and how do they connect?” Follow this with an HR question, e.g. “Which departments had the highest voluntary turnover this year compared to last year?”
The expected output: A plain-English summary of each tab and how they link together, plus a direct answer to the HR question, with references to the cells Claude used.
HR tip: Claude provides answers that include cell-level citations, which you can click on to navigate to the referenced cell. This allows you to show leaders exactly where a number came from, making the analysis easier to defend.
Look out for: Like all AI tools, Claude can make assumptions about the data. This might include the date range or which employees are included. Be specific and tell it what the data covers up front, and remember not to upload any identifiable employee data without company approval.
Tools like Claude for Excel are changing how HR professionals work with people data. Learn how to use AI effectively so you can streamline analysis, interpret results, and make better-informed HR decisions.
AIHR’s Artificial Intelligence for HR Certificate Program will help you:
✅ Use generative AI tools like Claude to simplify everyday HR tasks and improve productivity
✅ Write effective AI prompts to generate relevant, accurate, and actionable outputs for HR workflows
✅ Apply AI responsibly by recognizing risks related to data privacy, security, and output accuracy
✅ Identify valuable AI use cases and develop a structured approach to integrating AI into HR processes.
💡 Explore the AIHR Demo Portal to preview lessons and discover how you can build your AI skills for HR.
Step 3: Clean and structure your people data
Make a copy of your Excel file before allowing Claude to edit anything, or ask Claude to create a copy and make edits there. You can also ask Claude to find and fix common problems in HR exports, such as duplicate employee IDs, inconsistent job titles, and mixed date formats. Add structure that keeps the data clean going forward, such as dropdown lists.
Example prompt: “Find duplicate employee IDs and standardize these job titles into 8 job families,” and “convert all hire dates to DD/MM/YYYY.”
The output should be a cleaned table with duplicates flagged, consistent job families, and a single date format, with changed cells highlighted so the reader can review them.
HR tip: Save standing rules (date format, job family names, etc.) in the add-in’s Instructions setting, so that Claude applies them automatically every time.
Look out for: Claude will always ask before editing a document and warn the user before overwriting data. Make sure you don’t approve any changes that you haven’t manually checked, and spot-check a sample of cleaned rows against your original data.
Step 4: Build an HR metrics dashboard
Decide on three to five HR metrics that are most important to leadership, such as headcount, turnover rate, or time to hire. Next, ask Claude to build a new dashboard tab using these metrics, with pivot tables and charts. Let Claude complete the task before clicking anything, then refine the output with follow-up prompts.
Example prompt: “Create a pivot table showing headcount by department and level, then add a stacked bar chart to visualize it.”
The output should be: A new tab with a pivot table, a chart, and a short written summary of what stands out (e.g., which level or department has the most people).
HR tip: Ask for highlighting on the numbers leaders act on, e.g., “Highlight any department where turnover is above 15%.”
Look out for: With Claude, first drafts often need formatting fixes, including colors, legends, and spacing edits. Some older guides state that Claude can’t create pivot tables – make sure you check the most current Anthropic docs for the latest guidelines.
Step 5: Add an assumptions tab for workforce planning
Firstly, make sure you understand what an assumptions tab is: a place for inputs you might change, such as the attrition rate, hires per quarter, or salary increases. Then, ask Claude to create an assumptions tab, and link the rest of the workbook to it. Test if it works by changing one input and checking that the plan updates to match.
Example prompt: “Add an Assumptions tab with editable inputs for attrition rate, hiring plan per quarter, and average salary increase, and link the model to them.”
The output should be: A new tab of clearly labeled inputs, with formulas elsewhere in the workbook pointing to it, so that changing one number updates headcount and cost across the plan.
HR tip: Ask Claude to add a fully loaded cost per employee (salary plus benefits and bonus), so leaders see the real cost of each hire.
Look out for: Inputs that aren’t actually linked. For example, when you raise headcount, confirm that salary costs rise as well.
Step 6: Run scenarios on your workforce plan
First, save a copy of the plan you have so far. Next, change one assumption at a time, and ask Claude to show the effect of each change. Then, ask for a side-by-side comparison of scenarios, for instance, base, best case, or worst case, to share with business leaders.
Example prompt: “Update the plan to assume 15% attrition instead of 10%. Show me what changes across departments.”
The output should be: An updated plan plus a before-and-after comparison by department, showing the change in headcount and cost.
HR tip: Model the questions leaders frequently ask, e.g., what happens if there is a hiring freeze in one team, or whether recruiting has the capacity to hit the hiring plan.
Look out for: Undo reverses most, but not necessarily all, of Claude’s changes, so it’s important to keep the original copy. Remember to present scenarios as estimates, not forecasts.
Step 7: Review every formula before you share
If there are any formulas you don’t understand, ask Claude to explain them in simple terms, and trace key numbers back to their source cells. Also ask Claude to find and explain any errors (e.g., #REF!, #DIV/0!) before the file goes to leadership.
Example prompt: “There’s a #REF! error in cell E15 on the Headcount tab. What’s causing it, and can you fix it?”
The output should be: An explanation of what caused the error and one or more fix options for you to choose from, with no changes made until you approve them.
HR tip: Review everything before you share it with anyone. AI output can look polished and still be wrong, and HR numbers drive pay, hiring, and budget decisions.
Look out for: Overcomplicated formulas and inconsistent results on multi-step requests. Anthropic has stated that the Excel add-in isn’t meant for final deliverables or audit-critical numbers without human review.
Next steps
Claude for Excel allows HR professionals to stay within a spreadsheet and ask questions, adjust assumptions, and find and fix errors – without needing extensive formula or data skills.
If you want to learn more about AI for HR, check out AIHR’s Artificial Intelligence for HR Certificate Program. You’ll learn how to leverage AI tools to be more productive and effective in your role and deliver high-quality work. You can explore the lessons for free via the demo portal now.