HR data sets are rare in the public domain because workforce data is among the most sensitive information an organization holds. It often includes personal, financial, and performance-related details that require careful protection. At the same time, HR teams are placing greater focus on data-driven decision-making. SHRM highlights the growing role of people analytics in improving workforce processes and supporting a positive employee experience.
Even when HR teams have the right systems in place, many still struggle to get full value from their HR technology and data. Gartner found that only 24% of HR functions believe they derive the maximum value from their HR technology. Only 35% of HR leaders feel confident their current approach to HR technology helps them achieve business objectives, and two out of three believe HR’s effectiveness will decline if they do not improve how they use technology.
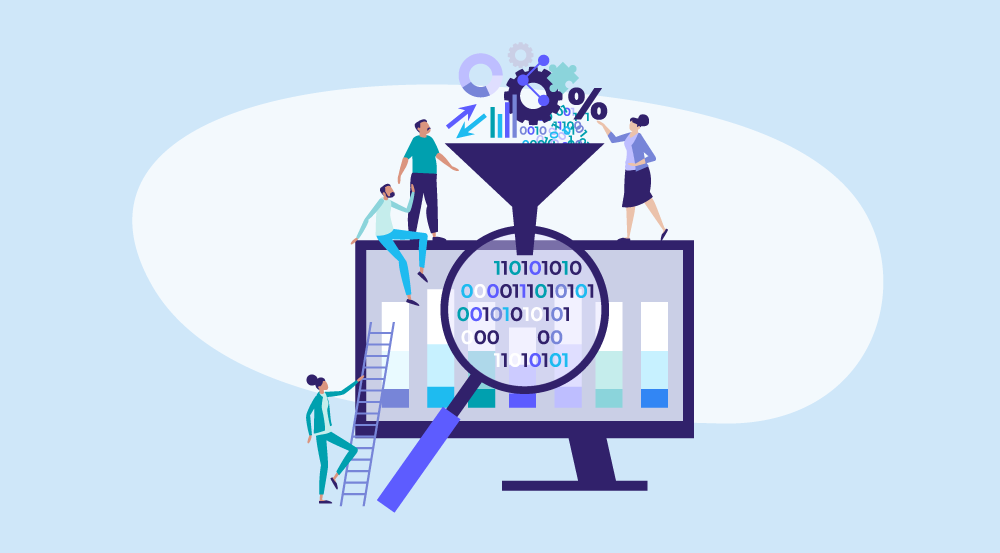
That gap often comes down to capability. HR teams need more hands-on practice turning raw workforce data into analyses they can trust. This article shares HR datasets you can use to build those skills safely, so you can explore patterns, build dashboards, and test analysis approaches without using real employee data.
Contents
What is an HR dataset?
How to choose the right HR dataset
9 HR datasets to practice your people analytics skills
How to generate a sample HR dataset with AI
Key takeaways
- HR datasets are difficult to access publicly because workforce data is sensitive, but practice data is still necessary for building analytics capability.
- Many HR teams are not getting enough value from their HR technology, which makes hands-on analytics practice even more important.
- Safe sample datasets let you practice people analytics, build dashboards, and test insights without creating privacy risks.
- The best dataset is not the biggest one, but the one that fits your question, structure, and analysis goals.
- AI can help you create synthetic HR datasets for practice, but the output still needs review before you use it
What is an HR dataset?
An HR dataset is a structured collection of workforce information, organized in rows and columns so HR teams can analyze it and spot patterns across the workforce. You will often find it in spreadsheets like Excel or CSV files, but it can also live in HR information systems, analytics platforms, or business intelligence tools.
In most HR datasets, each row corresponds to an employee or employment record, and each column corresponds to a specific variable. Common variables include job role, tenure, salary band, location, department, and performance rating.
When HR teams structure data this way, they can build dashboards, track trends, and back decisions with evidence instead of assumptions. For example, a dataset might combine tenure, engagement scores, salary bands, and an attrition indicator. With that structure in place, HR professionals can explore questions around retention, engagement, and workforce distribution.

How to choose the right HR dataset
Choosing the right HR dataset can be the difference between basic reporting and real workforce insight. When your data is clean, structured, and aligned with the question you want to answer, your analysis becomes faster, clearer, and much more useful.
The goal is not to find the largest dataset available, but rather to find one that is organized and built to support the analysis you want to run. Here’s how to select the best dataset for your needs.
Match the dataset to your goal
Start with the question you want to answer. That question should guide what you include, and just as importantly, what you leave out.
If you are analyzing turnover, look for variables like tenure, role, department, and an attrition indicator. For engagement analysis, pair survey scores with context such as manager, job level, or location so you can compare results across groups.
Choose the right dataset structure
Most HR analyses work best when each row represents one employee (or employment record), and each column represents a variable. This tabular format makes it easier to filter, group, and visualize workforce data.
Use the simplest format that works well with your tools. For example, Excel- and CSV-friendly datasets tend to perform better when they follow a consistent table structure rather than mixing layouts across multiple sheets.
Look for clearly defined variables
A useful dataset uses consistent field names and clear definitions. Variables like tenure, salary band, performance rating, and promotion history should be easy to interpret so dashboards and analyses stay accurate.
Ensure the dataset is large enough
Very small datasets rarely reveal reliable trends. A dataset that covers multiple departments, roles, and tenure levels allows HR teams to compare groups and spot patterns that hold up beyond one-off changes.
Confirm the dataset is safe to use
Public training datasets are usually anonymized or synthetic, which lets HR professionals practice analytics without exposing real employee information. Even then, it is worth checking that the dataset does not include direct identifiers or combinations of details that could make individuals easy to recognize.
Public HR datasets are a great way to practice your people analytics skills safely. AIHR’s People Analytics Certificate Program helps you build the practical skills to analyze HR data, create dashboards, and turn workforce data into clear, business-relevant insights.
In AIHR’s People Analytics Certificate Program, you’ll learn how to:
✅ Prepare and manipulate HR data in Excel
✅ Build dashboards and interactive reports in Excel and Power BI
✅ Apply core statistical analyses to interpret data and support decision-making.
9 HR datasets to practice your people analytics skills
The datasets below provide a safe way to practice common people analytics tasks, such as identifying attrition patterns, exploring engagement trends, and building simple dashboards. They include realistic variables like tenure, compensation, performance ratings, and satisfaction scores, which makes them useful for building analysis skills you can apply to day-to-day workforce questions.
1. Human resources dataset
This dataset comes as a bundle of linked CSV files, not a single table. You can practice the kind of HR analysis that combines HRIS data with pay ranges, recruiting spend, and (for production roles) operational performance.
Examples of what’s inside
- Core HR employee data (core_dataset / HRDataset_v9 / HRDataset_v13): Includes employee demographics, department and position, pay rate, manager, hire and termination details, and performance score.
- Engagement and satisfaction fields (HRDataset_v13): Adds engagement survey results, employee satisfaction, special projects count, last performance review date, and days late in the last 30 days.
- Salary ranges by position (salary_grid): Lists positions with salary and hourly ranges (min, mid, max), so you can compare employee pay against a defined range for the role.
- Recruiting spend by source (recruiting_costs): Shows spend per recruitment source across months (plus totals), which you can link to employee source-of-hire fields in the HR dataset.
- Production staff performance metrics (production_staff): Includes production-focused outcomes like abutments/hour (week 1 and week 2), daily error rate, and 90-day complaints, alongside department/position, pay, manager, and performance score.
Try this analysis
- Compare termination patterns across departments and positions using employment status, termination date, and termination reason
- Compare pay rate by position and check whether employee pay sits below/within/above the salary grid ranges for the same position
- Evaluate recruitment channel efficiency by combining employee source (from the HR dataset) with recruiting spend (from recruiting_costs), then calculating hires per source and spend per hire
- Use the production staff file to explore predictors of suboptimal performance, using outcomes such as daily error rate or 90-day complaints, and testing how factors like role, pay, manager, and performance score relate to those outcomes
- In HRDataset_v13, explore whether engagement or satisfaction patterns differ for employees who stayed vs those who left (using termination fields).
Get started
Download the dataset from the Kaggle page or use the mirror download (no sign-in). Use the codebook to review the data dictionary, variable definitions, and dataset structure.
2. HR analytics dataset
This dataset supports attrition analysis with a structure that works especially well for dashboard practice. It includes 1,480 employee records and combines attrition with job context, salary banding, and employee experience measures, so you can build clear segment comparisons in BI tools.
Examples of what’s inside
- Attrition outcome: Shows whether an employee left the organization.
- Job and role context: Captures department, job role, and job level so you can compare groups across the organization.
- Compensation: Includes monthly income and salary banding so you can analyze pay patterns alongside attrition.
- Work patterns: Includes overtime status and business travel information.
- Employee experience: Includes satisfaction measures and work-life balance ratings.
- Tenure and progression: Tracks time in the organization and internal movement, including time in role, time since last promotion, and time with current manager.
Try this analysis
- Compare attrition rates across departments, job roles, and job levels
- Compare attrition patterns across salary bands and income ranges
- Compare attrition between overtime and non-overtime employees, and across business travel categories
- Compare satisfaction and work-life balance ratings for employees who stayed versus those who left
- Analyze whether time in role and time since last promotion show different patterns for stayers versus leavers
- Combine job level, salary band, overtime, and progression timing to explore which segments show higher attrition.
Get started
Download from the dataset page on Kaggle or use the mirror download (no sign-in).
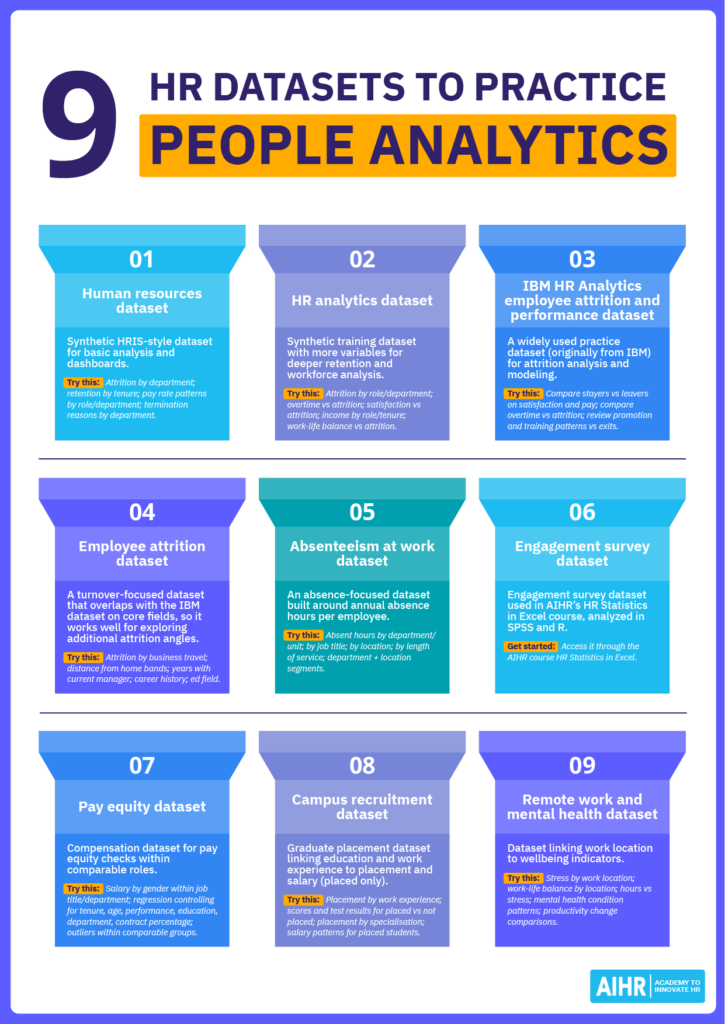
3. IBM HR analytics employee attrition and performance dataset
This dataset is widely used in people analytics practice because it is detailed enough to support meaningful analysis while remaining manageable. IBM originally released it for analytics practice, and it supports workforce pattern analysis as well as attrition exploration and modeling. It includes 1,470 employee records and 35 variables, which makes it suitable for dashboarding, statistical analysis, and introductory predictive modeling.
Examples of what’s inside
- Attrition: Shows whether an employee left the organization (Yes/No).
- Department and job role: Shows where employees work and what roles they perform.
- Monthly income and salary increase: Captures pay level and recent pay growth using monthly income and percent salary hike.
- Overtime: Indicates whether employees work overtime (Yes/No).
- Satisfaction and work-life balance: Includes job satisfaction, environment satisfaction, relationship satisfaction, and work-life balance ratings on numeric scales.
- Tenure and progression: Tracks time in the organization and recent progression using years at company, years in current role, years since last promotion, and training times last year.
Try this analysis
- Compare attrition rates across departments and job roles to see where exits concentrate
- Compare attrition between overtime and non-overtime employees, then review whether satisfaction scores differ across those groups
- Compare job satisfaction, environment satisfaction, relationship satisfaction, and work-life balance for employees who stayed versus those who left
- Examine whether monthly income and percent salary hike differ between employees who stayed and those who left within the same department or job role
- Analyze whether years at the company, years in the current role, years since the last promotion, and training times last year show different patterns for employees who stayed versus those who left.
Get started
The original dataset was once hosted by IBM but is now commonly accessed through a mirror on Kaggle (mirror).
4. Employee attrition dataset
If you want to focus on employee turnover, this dataset supports retention analysis, dashboard practice, and exploration of factors that often relate to attrition. It gives you enough context to compare groups and test patterns without adding unnecessary complexity.
This dataset includes several of the same core attrition fields as the IBM HR dataset above. To avoid repeating the same examples, the sections below highlight additional variables you can use to explore attrition from different angles.
Examples of what’s inside
- Business travel: Shows how often employees travel for work, which allows comparison of attrition patterns across travel categories
- Distance from home: Captures commuting distance so you can explore whether longer commutes align with higher exit rates
- Career history: Includes total working years and number of companies worked, which supports analysis of attrition across different career profiles
- Manager relationship and stability: Tracks years with current manager so you can explore whether manager stability aligns with retention
- Education field: Captures the education field to compare attrition patterns across backgrounds.
Try this analysis
- Compare attrition rates across business travel categories
- Group employees into distance-from-home bands and compare attrition across those bands
- Compare attrition patterns across different career history groups (for example, by total working years or number of companies worked)
- Analyze whether attrition differs by years with current manager
- Compare attrition rates across education fields
- Combine business travel and distance from home to explore whether certain combinations align with higher attrition.
Get started
Download this dataset from GitHub.
5. Absenteeism at work dataset
If you want to explore patterns in employee absence, this absenteeism dataset focuses on absence behavior across a workforce. It contains 8,336 employee records and 13 variables. Because the dataset uses one row per employee, you can quickly analyze absence trends across roles, locations, and demographic groups.
Examples of what’s inside
- Annual absent hours: Captures total absence hours per employee for the year.
- Department, division, and business unit: Shows where employees sit in the organization so you can compare absence across teams.
- Job title: Identifies the role employees perform, which helps you compare absence patterns across roles.
- City and store location: Provides location context so you can examine whether absence differs by site.
- Length of service: Captures tenure so you can explore whether absence patterns differ for newer vs longer-tenured employees.
Try this analysis
- Compare annual absent hours across departments, divisions, and business units
- Compare annual absent hours across job titles to identify roles with higher absence
- Compare annual absent hours across city and store locations to spot location-level differences
- Analyze whether annual absent hours differ by length of service
- Combine department and store location to identify specific segments with higher absence hours.
Get started
Lyndon Sundmark created this dataset for learning purposes, with a focus on predicting absence as an outcome. The dataset can be downloaded here (mirror).
6. Engagement survey dataset
Engagement survey datasets are difficult to access because they often contain confidential, company-sensitive information.
AIHR uses an engagement survey dataset in the HR Statistics in Excel course. The dataset includes responses from 85 individuals who completed an engagement survey. It covers variables such as performance rating and function group, along with measures including innovation behavior, multidimensional engagement scores, personal initiative, career management behavior, mobility behavior (likelihood of leaving the company), and organizational and professional commitment.
The course analyzes the same dataset in both SPSS and R. Students receive a dataset briefing and codebook, plus a set of six questions to answer. Each question connects to a lesson that explains how to run analyses such as t-tests, ANOVA, and multiple linear regression.
Get started
This dataset is not available as a free download. You can access it through AIHR’s HR Statistics in Excel course, which is available as part of the People Analytics Certificate Program or Full Academy Access.

A screenshot from the course with the dataset on the left. Data is analyzed in SPSS.

The same data is also analyzed in R. In this fragment, the data is checked for homoscedasticity.
7. Pay equity dataset
Pay equity analysis examines whether employees who perform work of equal value receive fair and consistent pay. HR teams typically run this analysis by comparing compensation across employees in comparable roles, then testing whether any pay differences remain after they account for factors that legitimately influence pay.
Examples of what’s inside
- Job title and department: Use these to define comparable groups before you compare pay.
- Salary: This is the main compensation field in the dataset.
- Gender: Use this to compare pay patterns across groups within comparable roles.
- Tenure and age: These fields help you account for experience-related differences when you interpret pay gaps.
- Performance rating: Use this to check whether performance aligns with pay differences inside the same role group.
- Education and contract percentage: These fields add context that can influence salary comparisons.
Try this analysis
- Compare average salary by gender within the same job title and department
- Compare salary distributions by gender within the same job title, then check whether gaps shrink when you split results by tenure bands
- Run a regression with salary as the outcome and gender as a predictor, while controlling for tenure, age, performance, education, department, and contract percentage
- Identify outliers by flagging employees whose salary sits far above or below peers in the same job title and department
- Compare pay patterns across contract percentages within the same job title to see whether contract type aligns with salary differences.
Get started
You can download this dataset here.
Did you know?
In real organizations, pay equity analysis uses highly sensitive payroll and demographic data. For training purposes, most publicly available pay equity datasets are anonymized or synthetic so HR professionals can practice compensation analysis safely.
8. Campus recruitment dataset
This campus recruitment dataset focuses on factors that influence whether students receive job placements after graduating. It captures educational performance, specialization, work experience, placement outcomes, and salary data for placed students. That combination makes it useful for practicing recruitment analytics and exploring how candidate attributes relate to hiring outcomes.
Examples of what’s inside
- Placement status: Shows whether a student received a job offer (Placed/Not Placed).
- Salary: Captures the salary outcome for students who were placed.
- Academic performance scores (ssc_p, hsc_p, degree_p, mba_p): Includes percentage scores for secondary education (SSC), higher secondary education (HSC), undergraduate degree, and MBA.
- Education background (ssc_b, hsc_b, hsc_s, degree_t, specialisation): Captures SSC and HSC education boards, HSC stream, degree type, and MBA specialisation.
- Work experience (workex): Indicates whether the student had prior work experience (Yes/No).
- Employability test score (etest_p): Includes the employability test percentage score.
Try this analysis
- Compare placement outcomes across students with and without work experience
- Examine whether higher academic scores (SSC, HSC, degree, MBA) align with placement outcomes
- Analyze whether employability test scores differ between placed and not placed students
- Compare placement outcomes across education background groups (stream, degree type, specialisation, education boards)
- For placed students, examine how salary varies by MBA score, specialisation, and work experience.
Get started
Download from the Kaggle page or use the mirror download (no sign-in).
9. Remote work and mental health dataset
This dataset explores how remote, on-site, and hybrid work arrangements relate to wellbeing indicators. It supports analysis of stress and burnout patterns, workload factors, and access to support resources, which makes it useful for practicing wellbeing and workforce experience analytics.
Examples of what’s inside
- Work location: Shows whether employees work remotely, onsite, or in a hybrid setup.
- Hours worked per week: Captures weekly working hours so you can explore workload differences.
- Work-life balance rating: Records self-reported work-life balance on a rating scale.
- Stress level: Captures stress as a category (e.g., low/medium/high).
- Mental health condition: Indicates whether employees report a mental health condition (and which one, where provided).
- Productivity change: Shows how productivity changed (category-based) so you can compare patterns across groups.
Try this analysis
- Compare stress levels across remote, hybrid, and onsite employees
- Compare work-life balance ratings across work locations
- Analyze whether higher weekly hours align with higher stress levels
- Compare mental health condition patterns across stress levels and work locations
- Explore whether productivity change differs by work location and stress level
- Check whether work-life balance ratings align with productivity change.
Get started
Download the dataset from the Kaggle page or use the mirror download (no sign-in).
How to generate a sample HR dataset with AI
AI can help you generate sample HR data, structure a dataset, and prepare it for practice analysis. But you should always review the output before using it, because AI can produce unrealistic values or inconsistent patterns.
This is especially important in HR, where workforce data is highly sensitive. Instead of using real employee information, you can create a synthetic dataset with fictional records that reflect the structure of real HR data. That allows you to practice analysis, build dashboards, and test ideas while reducing privacy and data governance risks.
One rule always applies: never input real employee data into AI tools or public environments. To generate a useful sample dataset, start with these steps:
Step 1: Pick a practice topic
Start by deciding what workforce question you want to explore. This gives the dataset a clear purpose and helps the AI generate information you can actually use. A defined topic also makes it easier to avoid unnecessary columns and keep the dataset relevant to the type of analysis you want to practice.
For example, if you want to practice attrition analysis, you will need variables that support segmentation and comparison, such as department, role, tenure, and an attrition indicator.
Step 2: Start with a basic employee list
Once your topic is clear, ask the AI tool to generate a simple employee table with fictional employees and core organizational information. This gives you a base dataset you can build on.
Typical starting columns include employee ID, job role, department, location, start date, and salary. Aim for 100 to 300 employees. That range usually gives you enough data to spot patterns while keeping the dataset easy to review and manage in Excel or BI tools.
Step 3: Add two to four analysis columns tied to your topic
After you have the base employee list, add variables that connect directly to your practice topic. These columns are what make the dataset useful for analysis because they let you test ideas, compare groups, and look for patterns. Common examples include engagement score, performance rating, absence hours, and an attrition flag.
Keep the scope focused. A small set of well-chosen variables often gives you clearer results than a wide dataset with dozens of fields you do not plan to analyze. It also makes it easier to check whether the AI has generated values that make sense.
Step 4: Ask for a CSV output you can paste into Excel
Request the dataset in CSV format so you can paste it into Excel, Power BI, Tableau, or another analytics tool without manual cleanup. This makes it easier to move from AI-generated output into actual analysis and helps keep the dataset structure aligned with how HR teams typically store and work with data.
Include instructions like: use commas as separators, include column headers, and output one row per employee.
Step 5: Add light realism (optional but recommended)
Synthetic datasets become more useful when they include simple patterns that resemble workplace data.
You can ask AI to apply a small set of realistic rules, like:
- Senior roles tend to have higher salaries
- Employees with low engagement are slightly more likely to leave
- Longer tenure employees tend to earn higher salaries.
These kinds of instructions make the dataset more realistic, but they still need to stay simple. If you add too many rules, the output can become harder to review and easier to distort.
Step 6: Do a quick sense check before analyzing
Before you start analyzing, scan the dataset to make sure it behaves like realistic workforce data. This step is important because AI can generate outputs that look convincing at first glance but contain errors, odd distributions, or values that do not fit together logically.
Start with two checks: scan for blanks or extreme outliers, and confirm that salary ranges and dates look plausible. A quick review now can save time later when results look odd for reasons that come down to data quality rather than the analysis itself.
Example AI prompts you can copy and paste
Prompt 1: Starter dataset
“Generate a fictional dataset of 150 employees for a made-up company. Output it as a CSV I can paste into Excel and include headers. Use these columns: Employee ID, department, role, location, start date, employment type (full-time/part-time), and salary.”
Prompt 2: Level-up dataset
“Generate a fictional dataset of 250 employees as a CSV and include headers. Use these columns: Employee ID, department, role level (1–5), manager ID, start date, salary, engagement score (0–100), performance rating (1–5), and attrition (Yes/No). Add light realism: higher role levels usually have higher salaries, and attrition is slightly more common among employees with lower engagement and shorter tenure.”
Prompt 3: Topic-focused dataset
“Generate a fictional dataset of 200 employees as a CSV and include headers. Use these columns: Employee ID, department, role, start date, location, salary, absence hours last year, engagement score (0–100), and performance rating (1–5). Make absence slightly higher for employees with lower engagement.”
To sum up
People analytics is becoming a core HR capability. If you want to make better decisions about hiring, retention, engagement, and performance, you need to feel comfortable working with data. That confidence comes from practice.
Public HR data sets can help you build that practice in a low-risk way. You can explore workforce questions, test your thinking, and get better at turning data into useful insights. As AI becomes more common in HR, it also helps to understand where it can support your work and where you still need to apply judgment.
That’s where focused upskilling can help. If you want to learn how to use AI in HR more confidently and responsibly, AIHR’s Artificial Intelligence for HR Certificate Program is a strong next step. If you want to build your ability to analyze workforce data and turn it into action, the People Analytics Certificate Program can help you develop those practical skills.


