When HR professionals talk about HR data analytics, the conversation often goes straight to dashboards and software. But behind serious people analytics work, there’s often a programming language doing the heavy lifting. For many HR data analysts, that language is Python.
Python is free, readable, and backed by libraries that cover the core HR analytics tasks you’ll run into, from calculating turnover rates to exploring pay equity. This article explores the five libraries worth knowing first.
Contents
Why Python for HR data analytics?
5 Python libraries and how they work in HR
How the 5 Python libraries work together
How to build your HR data analytics skills
FAQ
Key takeaways
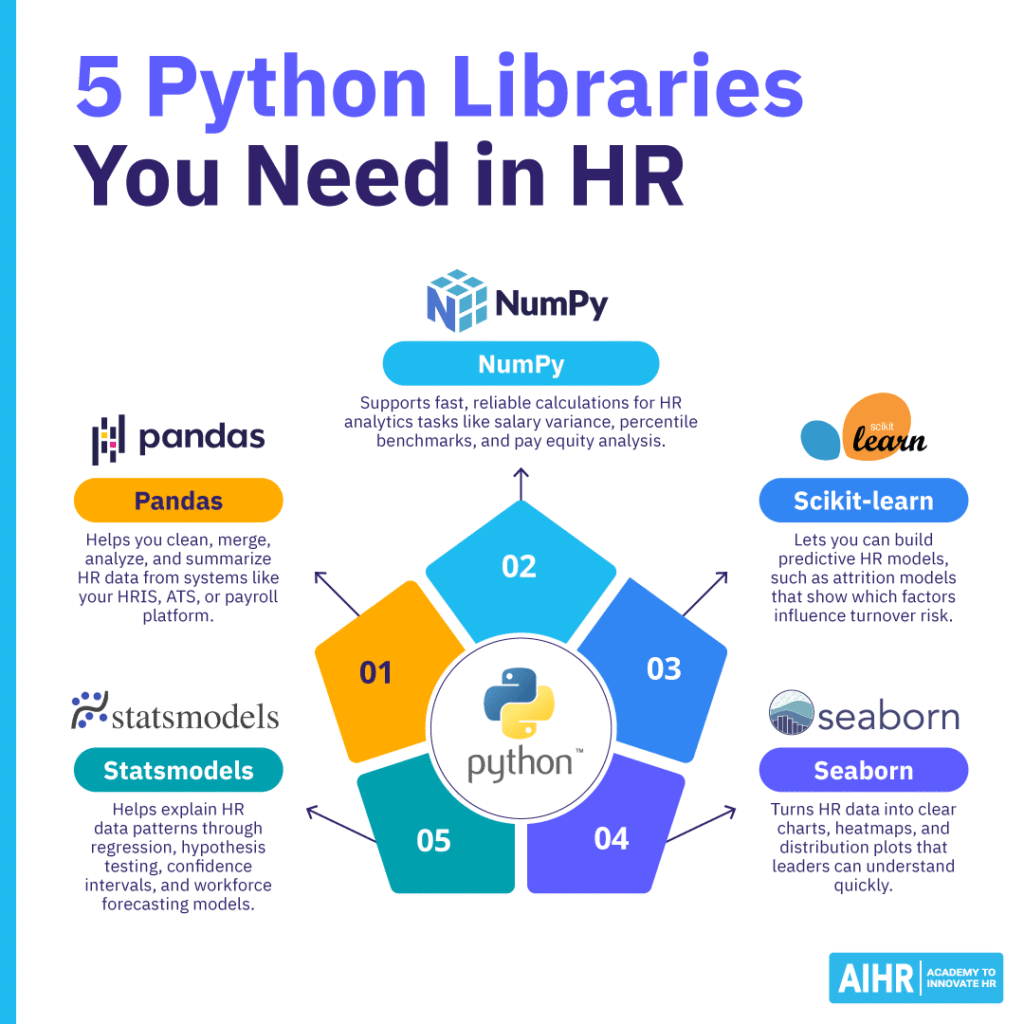
- Pandas is the first library to learn for loading, cleaning, and analyzing HR data from your HRIS or payroll system.
- NumPy provides the calculation layer behind many statistical tasks, including pay equity analysis and hypothesis testing.
- Scikit-learn helps you build predictive HR analytics models, such as attrition-risk models.
- Seaborn turns workforce data into charts you can use in leadership presentations.
- Statsmodels gives you p-values, confidence intervals, and regression outputs that help make HR findings defensible.
Why Python for HR data analytics?
Excel is still a common starting point for HR analytics and works well for many basic reports, but it has limits. Large datasets can slow it down, machine learning is hard to do in it, and charts often need manual cleanup before they’re ready to share.
Python removes many of those limits. You can use it to clean a messy headcount export, calculate attrition by department, visualize which factors relate to turnover, and build a model that flags employees who may be at higher risk of leaving. The five libraries below each handle a different part of that workflow. Together, they cover the core Python toolkit for HR analytics.

5 Python libraries and how they work in HR
Below is key information on five Python libraries, along with practical examples of how you can apply them in your HR work.
The HR dataset we’ll use
All of the code examples below reference theIBM HR Analytics Employee Attrition and Performance dataset, a freely available practice dataset created by IBM data scientists and hosted on Kaggle.
1. Pandas
Pandas is an open-source Python library for working with tabular data, which is the kind of data you usually export from an HRIS, ATS, or payroll system. Its main data structure is called a DataFrame. Think of it as a smarter spreadsheet that you can filter, group, merge, and calculate against with short, readable code.
Data cleaning takes up a large share of most HR analysts’ time, but Pandas can automate much of it. When your HRIS export includes inconsistent job titles, blank fields, and duplicate rows, a few lines of Pandas code can standardize, fill, and deduplicate that data.
What you can do with it on HR data
Using the IBM HR Analytics dataset (1,470 employees, available on Kaggle), Pandas lets you:
- Calculate your overall attrition rate: df[‘Attrition’].value_counts(normalize=True) * 100
- Break attrition down by department: df.groupby(‘Department’)[‘Attrition’].value_counts(normalize=True).unstack()
- Compare average salary by gender: df.groupby(‘Gender’)[‘MonthlyIncome’].mean()
- Understand the overtime effect on turnover: df.groupby(‘OverTime’)[‘Attrition’].value_counts(normalize=True).unstack()
- Flag higher-risk employees by combining conditions, such as no recent promotion, overtime, and pay below the department average.
What to learn first: groupby(), value_counts(), merge(), fillna(), and describe(). Those five methods cover most routine HR data analysis tasks.
2. NumPy
NumPy (short for Numerical Python) is a library for fast math on lists of numbers. Pandas is built on top of it, so when you run a Pandas calculation, NumPy often does the work underneath.
You won’t need NumPy for every report, but you’ll likely use it when your analysis moves into statistical testing. This is useful for work such as pay equity analysis or workforce planning, where you need calculations to be accurate and efficient.
What you can do with it on HR data
- Convert salary columns into arrays for statistical comparison: male_sal = np.array(df[df[‘Gender’]==’Male’][‘MonthlyIncome’])
- Calculate salary variance by group before running a t-test: np.var(female_sal, ddof=1) vs np.var(male_sal, ddof=1)
- Compute workforce percentile benchmarks: np.percentile(df[‘MonthlyIncome’], [25, 50, 75])
- Build custom HR metric calculations across large datasets more efficiently than a loop would.
Think of NumPy as the layer that makes the math reliable and fast. You’ll use it most often when you run statistical tests, especially variance and t-tests in pay equity work.
Python libraries can help you explore workforce data faster, but tools only create value when you ask the right questions and interpret the results accurately. Build the people analytics skills you need to move from raw data to credible insights that guide better people decisions.
AIHR’s People Analytics Certificate Program will teach you how to:
✅ Prepare, analyze, and visualize HR data to uncover workforce patterns
✅ Build dashboards and reports that make people insights easier to use
✅ Apply core statistical concepts to test assumptions and interpret results
✅ Present data-driven recommendations that influence stakeholder decisions
🎓 Visit the AIHR Demo Portal to preview lessons, explore resources, and discover what to learn next.
3. Scikit-learn
Scikit-learn is Python’s main machine learning library. It includes tools for classification, regression, clustering, and data preparation. It’s also designed to be readable, making it more accessible for HR analytics practitioners who aren’t machine learning specialists.
This library helps you move from describing what happened to predicting what may happen next. For example, it can help you move from “turnover was 18% last year” to “these employees may be more likely to leave next quarter”.
What you can do with it on HR data
- Encode HR categories like Department, JobRole, and Gender so a model can use them: LabelEncoder() or OneHotEncoder()
- Split your dataset into training and test sets so you can check model accuracy honestly: train_test_split(X, y, test_size=0.2, random_state=42)
- Train a logistic regression model to predict attrition: LogisticRegression().fit(X_train, y_train)
- Train a Random Forest classifier for higher accuracy: RandomForestClassifier().fit(X_train, y_train)
- Output a ranked list of feature importances, which shows which variables are most linked to an employee leaving.
What to learn first: train_test_split, LogisticRegression, RandomForestClassifier, accuracy_score, and feature_importances_. Feature importance is often one of the most useful outputs you can bring to an HR leadership meeting, because it shows which factors matter most in the model.
4. Seaborn
Seaborn is a Python data visualization library built on top of Matplotlib. Matplotlib gives you full control over charts, but it can take a lot of code to produce basic results. Seaborn focuses on statistical charts and creates clean outputs with less effort.
This matters because HR analytics only creates value when people understand the findings. Seaborn helps you create correlation heatmaps, distribution plots, and grouped bar charts that make workforce data easier to read for a CFO, CHRO, or HR leadership team.
What you can do with it on HR data
- Generate a correlation heatmap across numeric HR variables to see which factors cluster with attrition: sns.heatmap(df.corr(numeric_only=True), annot=True, cmap=’coolwarm’)
- Compare salary distributions between employees who left and those who stayed: sns.boxplot(x=’Attrition’, y=’MonthlyIncome’, data=df)
- Visualize attrition counts by department side by side: sns.countplot(x=’Department’, hue=’Attrition’, data=df)
- Show how age interacts with attrition: sns.histplot(data=df, x=’Age’, hue=’Attrition’, kde=True)
5. Statsmodels
Statsmodels is a Python library for statistical modeling. Scikit-learn focuses mainly on prediction. Statsmodels focuses on explanation. It gives you regression outputs with p-values, confidence intervals, R-squared values, and model checks.
That matters when HR findings need to stand up to questions from finance, legal, or a regulator. Statsmodels can help you show whether a pattern is likely meaningful or whether it may simply be noise in the data.
What you can do with it on HR data
- Pay equity regression: You can test whether salary differences between groups remain after you control for fair job-related factors, such as experience, tenure, and education:
Python
import statsmodels.formula.api as smf
model = smf.ols(
“MonthlyIncome ~ Age * C(Gender) + YearsAtCompany + Education”,
data=df
)
results = model.fit()
print(results.summary())
The output gives you a coefficient for gender, which is the size of the unexplained gap; a p-value, which shows whether that gap is statistically meaningful; and an R-squared value, which shows how much salary variation your model explains. As a common rule of thumb, a p-value below 0.05 means the result is unlikely to be due to chance alone.
- Hypothesis testing: You can use a two-sample t-test to check whether the salary difference between two groups is statistically meaningful. Statsmodels provides this via: statsmodels.stats.weightstats.ttest_ind(group_a_salaries, group_b_salaries). The widely used companion library scipy offers a similar function: scipy.stats.ttest_ind(). Both are common in HR analytics workflows. Run an F-test first to check whether the groups have equal variance before you choose the right t-test version.
- Workforce forecasting: Statsmodels also supports time-series models, such as ARIMA. These models help you project headcount needs over a period, such as the next 12 months, based on historical hiring and attrition data.
How the 5 Python libraries work together
In practice, these Python libraries work as a sequence, rather than five separate tools. A typical HR data analytics workflow looks like this:
- Pandas loads and cleans the raw data from your HRIS or workforce dataset
- NumPy supports the statistical calculations you run during analysis
- Seaborn visualizes patterns and relationships so you know where to focus
- Statsmodels tests whether those patterns are statistically meaningful
- Scikit-learn builds a predictive model once you know which variables matter.
You don’t need all five for every analysis. Attrition reporting uses mostly Pandas and Seaborn. A pay equity audit adds Statsmodels. A flight-risk model uses Pandas, NumPy, and Scikit-learn. Once you know what each library does, you also know which one to use and which one to leave out.
How to build your HR data analytics skills
Building HR data analytics skills takes more than learning tools. You also need the statistical knowledge to choose the right method, interpret results, and connect your findings to real HR decisions.
Start with the statistical foundations
Python libraries are powerful, but they work best when you understand the concepts behind them. For example, running a t-test in Statsmodels is straightforward once you know what a t-test measures. A t-test helps you compare two groups and see if the difference is likely meaningful.
The same applies to attrition modeling in Scikit-learn. The model becomes more useful when you understand feature importance, which shows which variables most affect the prediction. This helps you explain how the model supports a business decision.
AIHR’s People Analytics Certificate Program is built around these foundations. Across 16 modules, it covers statistical analysis, including t-tests, correlation analysis, analysis of variance (ANOVA), and hypothesis testing. It also covers data preparation, data manipulation, dashboarding, and a full people analytics case study.
The program uses practical HR scenarios, such as employee turnover and absence reporting. In the capstone project, you take on the role of an HR Analyst. You answer real business questions using descriptive analysis and hypothesis testing. Once you’re ready to grow your HR data analysis skills, the Python libraries in this article will build on that foundation.
Practice with real HR data
To build Python proficiency alongside or after the program, download the IBM dataset from Kaggle and work through it in this sequence:
- Pandas: Load the data set, check for missing values, and calculate attrition rates by department.
- Seaborn: Create a correlation heatmap and visualize the relationship between monthly income and attrition.
- Statsmodels: Run a pay equity regression and interpret the p-values.
- Scikit-learn: Train an attrition classification model and review the feature importance scores.
The HR Analytics using Python notebook is a useful reference when you get stuck on syntax. When you’re ready to go beyond the IBM dataset, AIHR’s 9 HR datasets for people analytics practice give you additional options to explore.
FAQ
No, not a deep one. Pandas, Seaborn, and NumPy are readable and well-documented. You can also find many free tutorials built around HR datasets. Scikit-learn and Statsmodels have a steeper learning curve, but both have strong documentation and active practitioner communities. Most HR analysts start with Pandas and Seaborn before using the other three.
With steady practice on real HR datasets, most HR professionals can reach working proficiency in Pandas and Seaborn within two to three months. Statsmodels and Scikit-learn usually take more time because they require stronger statistical confidence alongside coding practice.
Start with Pandas, because everything else depends on it. Until you can load, clean, filter, and group a workforce dataset confidently, the other four libraries won’t take you far.
Yes. Kaggle Notebooks and Google Colab both run Python in a browser and usually include pandas, NumPy, scikit-learn, and seaborn. Statsmodels is also available in both environments, although you may need to install it with !pip install statsmodels if it’s not already loaded. These platforms are the fastest way to start practicing without setting up Python on your own computer.