
A recruitment dashboard gives organizations a clear, shared view of how talent moves from demand to delivery, at a time when hiring decisions carry increasing business risk. As labor markets tighten and skills gaps continue to grow, leaders need visibility into critical roles, emerging capability needs, and where the hiring pipeline starts to break down.
Recruitment analytics make it possible to see not only how quickly roles are filled, but also whether the right skills are being identified and deployed where they matter most. The impact of these decisions is not evenly distributed. McKinsey research shows that top performers in critical roles can deliver up to 800% more productivity than average performers, turning accurate hiring into a major source of business value.
When recruitment data is structured, visible, and reviewed consistently, organizations are better able to close skills gaps, focus on high-impact roles, and align hiring with broader strategic goals. This article explains what a recruitment dashboard is, which metrics to track, and how to build and use dashboards that support better hiring decisions across the organization.
Want to take a broader, end-to-end view of talent acquisition, not just dashboard reporting? Download our Data-Driven Talent Acquisition Guide for a practical 9-step process, plus the tools, data, and metrics you need to optimize each stage.
Contents
What is a recruitment dashboard?
Benefits and limitations of using recruitment dashboards
Key metrics to track in your recruitment dashboard
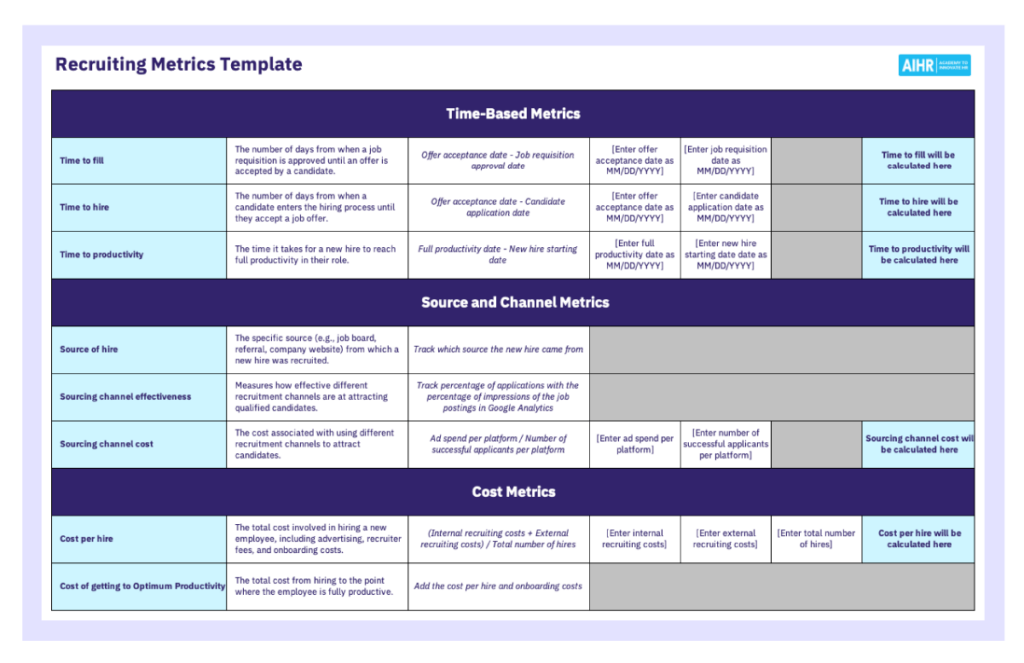
Recruiting metrics template
Recruitment dashboard examples
How to create a recruitment dashboard: 8 steps
Common mistakes to avoid when building a recruitment dashboard
FAQ

What is a recruitment dashboard?
Recruitment dashboards are used by recruiters, talent acquisition leaders, HR leaders, and hiring managers to support both day-to-day and strategic decision-making. They provide a single, visual view of how hiring is performing across roles, teams, and over time.
A recruitment dashboard brings together key hiring metrics such as time to hire, time to fill, candidate pipeline volume, source performance, offer acceptance rates, and hiring manager responsiveness, and presents them through clear charts, tables, and trend views. Instead of working through multiple reports, users can quickly see where demand is building, which roles are progressing, and where delays or drop-offs are occurring in the hiring process.
Beyond tracking speed and volume, well-designed recruitment dashboards also help HR teams assess upstream hiring quality. Selection quality and role fit have a strong influence on employee engagement, a factor that Gallup research links to improved business outcomes consistently.
Teams with higher engagement show around 18% higher productivity, 23% higher profitability, and 18% to 43% lower turnover, depending on the organization’s baseline turnover levels. By making early hiring indicators more visible, recruitment dashboards support a shift from filling roles quickly to building a workforce that performs well and stays longer.
Depending on the company’s size and maturity, recruitment dashboards are commonly built within applicant tracking systems, business intelligence tools, or spreadsheets such as Microsoft Excel. Regardless of the technology used, the goal remains the same: turning hiring data into clear, actionable insight that supports better decisions.
Benefits and limitations of using recruitment dashboards
Recruitment dashboards provide hiring teams with a shared, data-driven view of what’s happening across the entire hiring process. When designed and utilized effectively, they enhance visibility, alignment, and decision-making throughout recruitment activities. At the same time, their impact depends heavily on the quality of the underlying data and the consistency with which the dashboards are used in practice.
Benefits
- Real-time visibility into hiring progress across roles, teams, and locations
- Recruiters and talent acquisition leaders can quickly identify bottlenecks, delays, and stalled roles
- Better prioritization due to highlighting of vacancies that require immediate attention
- Improved accountability through more visible ownership, timelines, and outcomes
- More informed conversations with hiring managers based on shared data rather than anecdotal feedback
- Reduce time spent compiling reports due to key hiring metrics being centralized in a single view.
The value of tracking recruitment metrics is well-documented. For example, Deloitte reports that Eaton, a global power management company, achieved double-digit improvements in talent acquisition performance by closely monitoring key metrics such as time to market, time to present, time to offer, and candidate velocity.
As a result, Eaton increased candidate velocity by 30% to 40% and expanded its talent network fourfold. This illustrates how consistent measurement can translate into tangible improvements across the hiring process.
Limitations
- Heavy reliance on accurate and consistent data entry in the ATS or source systems
- Complex hiring challenges may be over-simplified if viewing metrics without sufficient context
- Risk of pushing teams to focus primarily on speed metrics, rather than quality of hire or candidate experience
- Ongoing maintenance required as hiring processes, roles, and priorities evolve
- Users may be overwhelmed if too many metrics or visual elements are included without a clear purpose.
Learn to build dashboards that drive hiring results
Recruitment dashboards are only as good as the strategy behind them. This program teaches you to measure what matters and turn data into decisions.
✅ Build dashboards to track employer branding, candidate quality, and funnel efficiency
✅ Master recruitment analytics to improve time-to-fill and hiring manager satisfaction
✅ Align talent metrics with business strategy for greater impact
✅ Learn sprint recruiting to speed up processes without sacrificing candidate experience
Learn at your own pace with the online Strategic Talent Acquisition Certificate Program.
Key metrics to track in your recruitment dashboard
An effective recruitment dashboard helps HR leaders understand where the hiring system is working, where it is slowing down, and where targeted intervention will have the greatest impact. Each metric should be interpreted as a signal within the broader recruitment process, rather than as a standalone score. The metrics below cover hiring speed, efficiency, quality, and candidate experience.
HR tip
According to Deloitte, it is important to treat “Attract” and “Hire” as distinct, measurable stages of the employee life cycle. Using a funnel view allows HR teams to manage the quality and conversion of each stage through clearly defined metrics, rather than relying on aggregate hiring outcomes alone.
Time to hire
Time to hire is the number of days it takes to move a candidate through the recruitment process, from when they enter the pipeline to when they accept an offer.
- What it measures: This metric shows how quickly hiring decisions are made once candidates are actively being considered. It reflects the efficiency of screening, interviewing, decision-making, and offering approvals.
- How to calculate: Track the date a candidate applies or is first contacted and the date they accept the offer. Subtract the start date from the offer acceptance date. Results are usually averaged across roles, teams, or time periods.
- Formula: Offer acceptance date − application or first contact date
- Leadership insight: Time to hire highlights where decision-making slows down after candidates have been identified. When it is high across many roles, it often reflects process complexity or slow approvals. When it is high in specific roles, it typically points to skills scarcity or unrealistic role requirements.
Time to fill
Time to fill is the total number of days required to fill a role, starting from when the position is approved to when a candidate accepts the offer.
- What it measures: This metric captures the full end-to-end hiring cycle, including planning, approvals, sourcing, and selection.
- How to calculate: Track the requisition approval date and the offer acceptance date for each role. Subtract the approval date from the acceptance date and average the results over time.
- Formula: Offer acceptance date − requisition approval date
- Leadership insight: Time to fill reflects workforce planning discipline as much as recruitment execution. Extended timelines often signal late approvals, unclear role scope, or misalignment between business demand and hiring capacity.
Cost per hire
Cost per hire is the average amount spent to recruit and hire one employee.
- What it measures: The financial efficiency of recruitment activities across sourcing, assessment, and hiring.
- How to calculate: Add all internal and external recruitment costs, including advertising, agency fees, technology, and recruiter time, and divide by the total number of hires.
- Formula: Total recruitment costs ÷ number of hires
- Leadership insight: Cost per hire is most meaningful when reviewed alongside quality and retention metrics. Higher costs can be justified when they result in strong, durable hires. Low costs combined with poor outcomes often indicate false efficiency rather than effective hiring.
Source of hire
Source of hire identifies the channel through which a successful candidate was hired.
- What it measures: The effectiveness and sustainability of different sourcing channels.
- How to calculate: Attribute each hire to their original sourcing source, such as referrals, job boards, career sites, or agencies, and calculate each source’s share of total hires.
- Formula: Number of hires from a source ÷ total hires
- Leadership insight: Source of hire reveals concentration risk in the talent strategy. Heavy reliance on a small number of channels reduces flexibility and increases exposure to market changes or sourcing disruptions.
Recruitment funnel effectiveness
Recruitment funnel effectiveness measures how efficiently candidates progress through each stage of the hiring process.
- What it measures: The alignment and efficiency of screening, assessment, interviewing, and decision-making stages.
- How to calculate: Divide the number of candidates who move to the next stage by the number entering the current stage. This can be calculated for each stage of the funnel.
- Formula: Candidates advancing to next stage ÷ candidates at current stage
- Leadership insight: High drop-off rates early in the funnel often point to poor sourcing quality or unclear role requirements. Drop-offs later in the process usually reflect assessment design issues, interview inconsistency, or misaligned expectations between candidates and hiring teams.
Offer acceptance rate
Offer acceptance rate is the percentage of job offers that candidates accept.
- What it measures: The competitiveness of offers and the effectiveness of the closing process.
- How to calculate: Divide the number of accepted offers by the total number of offers made within a given period.
- Formula: Accepted offers ÷ total offers made
- Leadership insight: Low offer acceptance rates are frequently driven by slow decision-making, unclear role value, or late-stage changes to scope or conditions. Compensation can be a factor, but it is rarely the only cause.
Quality of hire
Quality of hire measures how well new employees perform and remain with the organization over time.
- What it measures: The long-term success and sustainability of hiring decisions.
- How to calculate: Combine agreed indicators such as early performance ratings, probation outcomes, engagement signals, and retention data into a composite score.
- Formula: Composite score based on selected performance and retention indicators
- Leadership insight: Quality of hire helps prevent trading speed for sustainability. Declining quality often signals rushed decisions, weak role clarity, or misaligned selection criteria, even when other recruitment metrics appear strong.
Download our free recruitment metrics template with built-in formulas to help you calculate these measures consistently and use them as inputs for your recruitment dashboard.
HR tip
Deloitte’s research shows that talent acquisition metrics such as pipeline health and readiness of candidates for critical roles form part of the core metric set CHROs rely on to guide strategic decisions. Tracking these indicators helps support leadership continuity and strengthen business resilience over time.
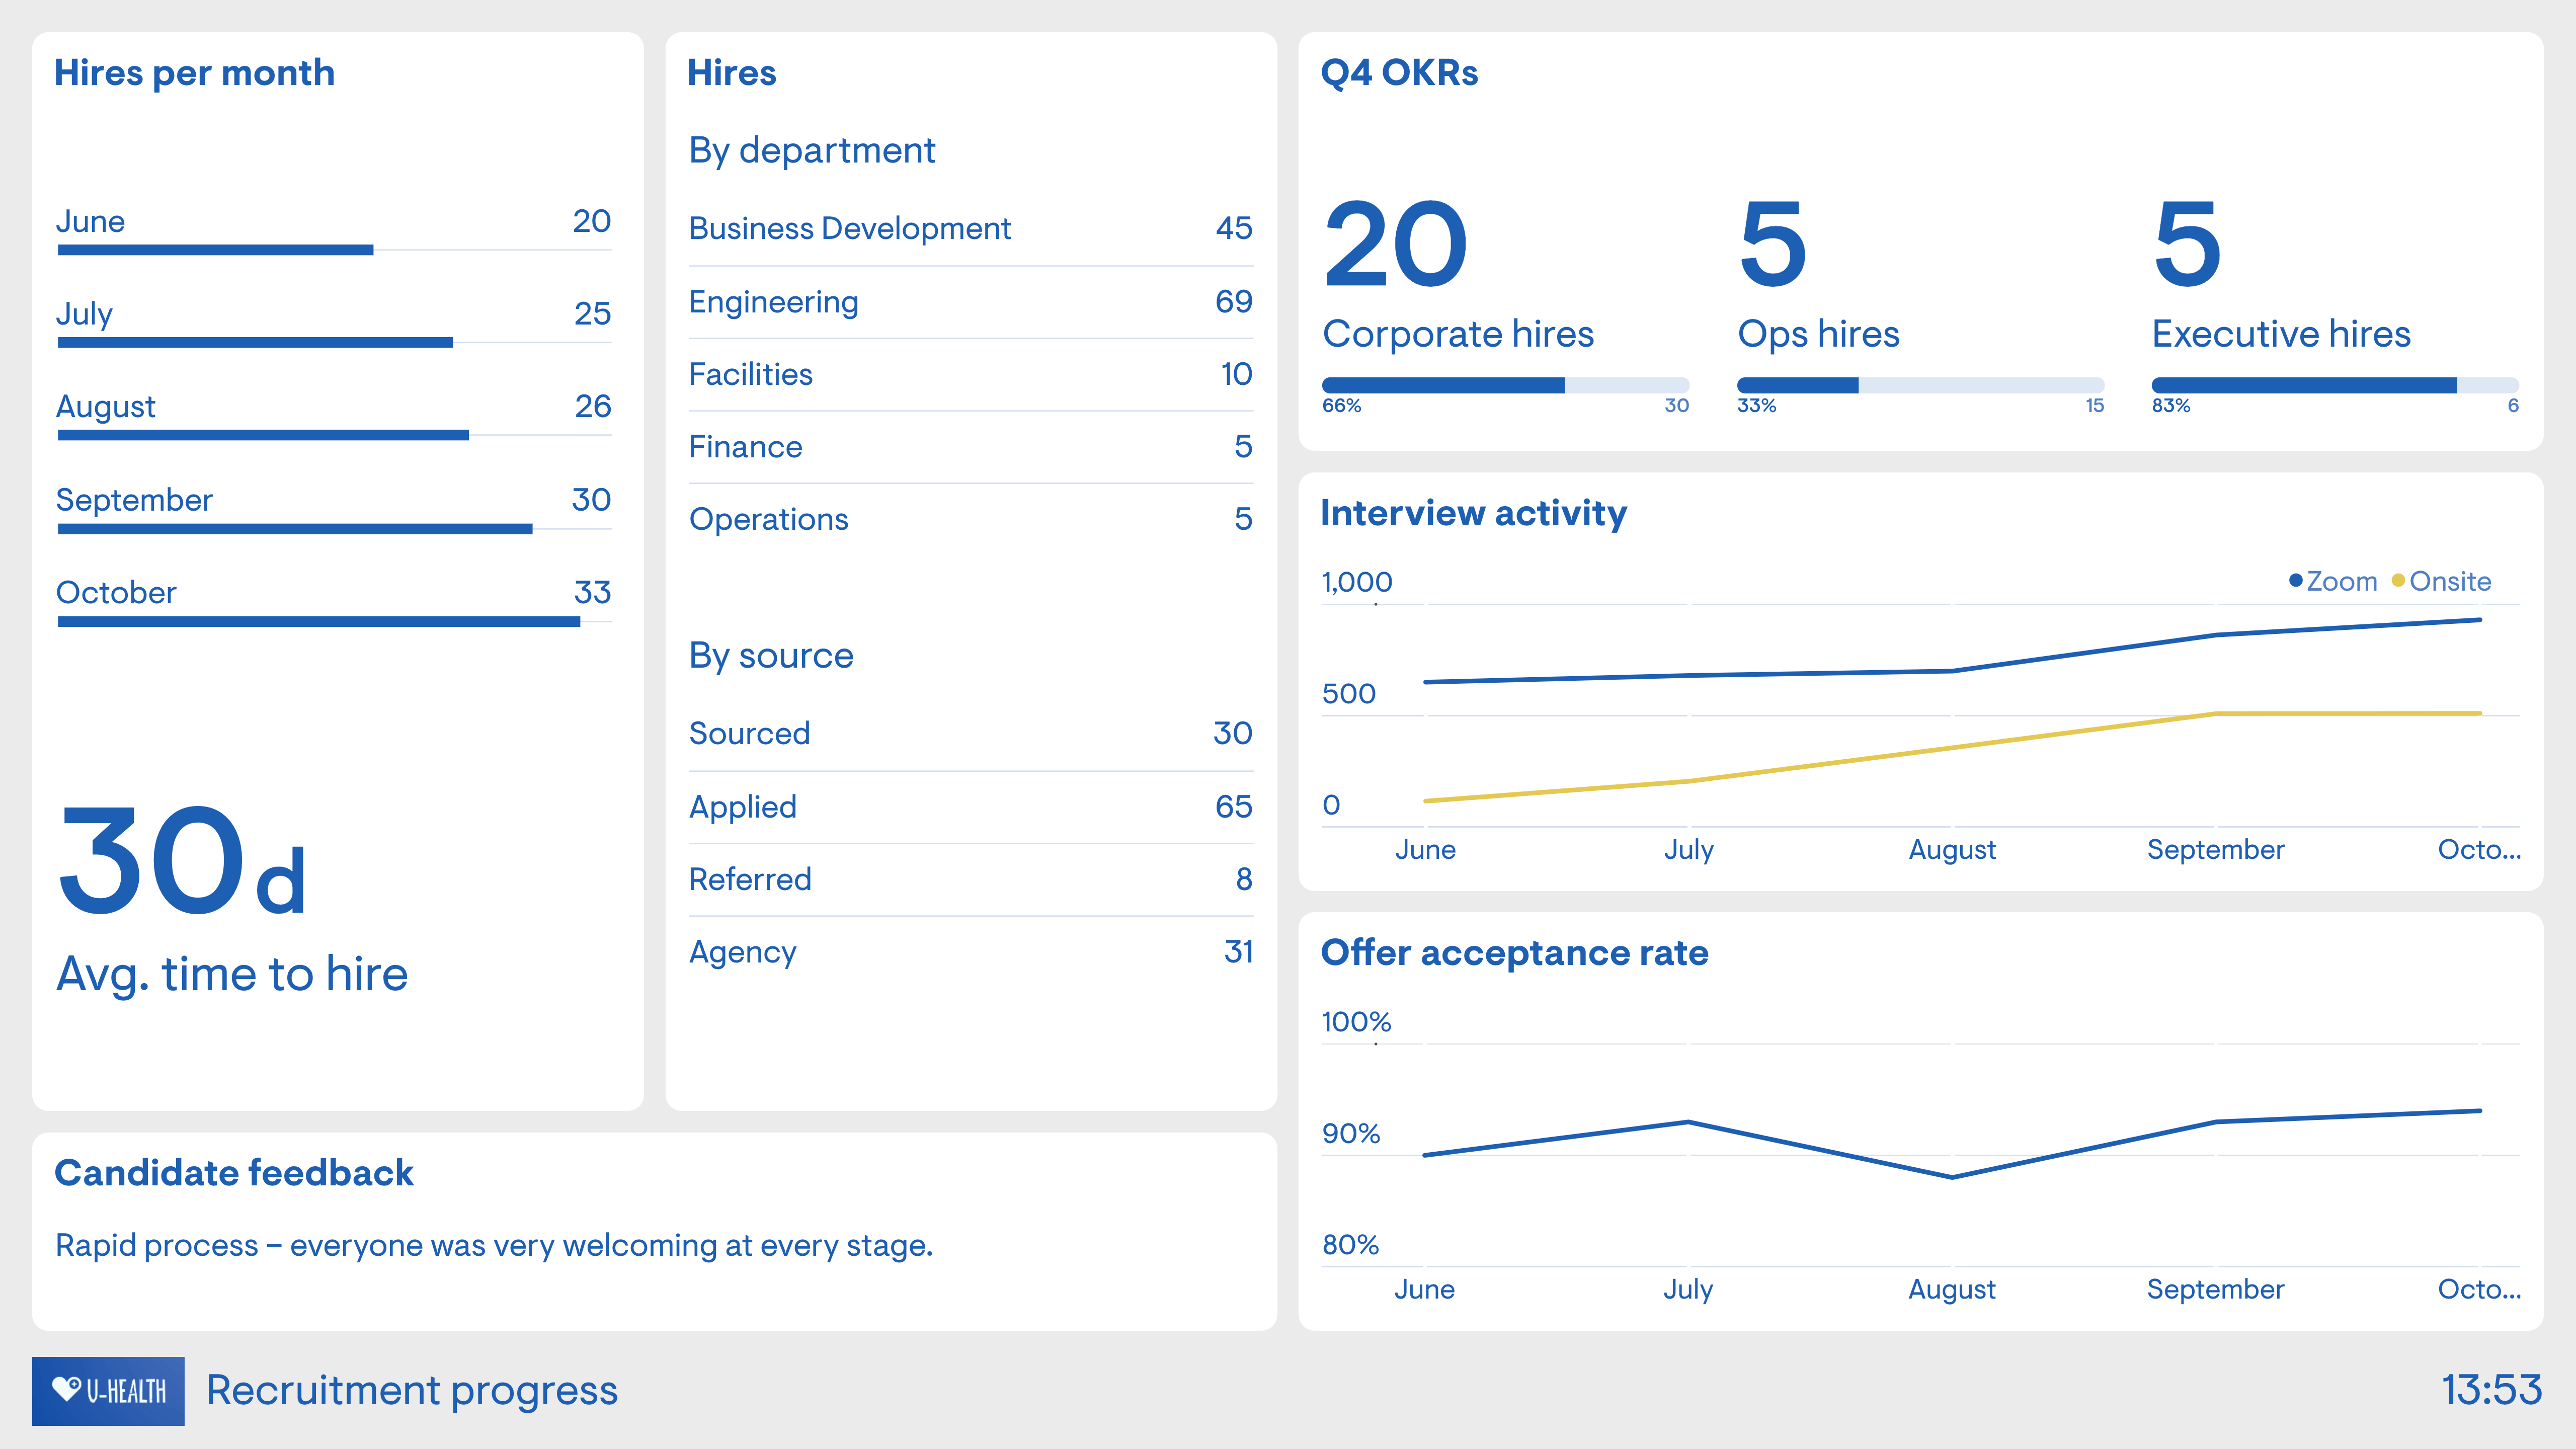
Recruitment dashboard examples
Recruitment dashboards are rarely one-size-fits-all. Most organizations rely on multiple dashboards, each designed to support a specific recruitment objective and decision set. In practice, different dashboards serve different audiences, from recruiters managing day-to-day activity to HR leaders reviewing performance and outcomes. The examples below show how recruitment dashboards are commonly used and what each is best suited for.
Recruitment KPI dashboard
A recruitment KPI dashboard provides a high-level view of how hiring is performing against plans and expectations. It focuses on delivery, capacity, and efficiency, helping talent acquisition and HR leaders understand whether recruitment activity is keeping pace with business demand. This dashboard is used to monitor progress over time, spot performance shifts, and support workforce and hiring planning, rather than to manage individual roles or recruiters.
Example metrics commonly included:
- Time to hire
- Time to fill
- Number of open requisitions
- Hiring volume versus plan
- Offer acceptance rate
- Cost per hire
→ Do this: Use a recruitment KPI dashboard to track trends and performance against targets over time. It works best for oversight, forecasting, and capacity planning, not for diagnosing root causes or managing day-to-day hiring activity.
Recruitment analytics dashboard
A recruitment analytics dashboard goes a step further than performance monitoring by examining the outcomes of hiring decisions. Rather than asking whether recruitment is on track, it focuses on whether current hiring approaches are delivering the right results. This dashboard connects recruitment data with downstream indicators such as performance, retention, and productivity, making it a strategic tool for evaluating and improving hiring effectiveness.
Example metrics commonly included:
- Quality of hire
- Early performance or probation success rates
- New hire retention or turnover
- Source quality and downstream performance
- Time to productivity
→ Do this: Use a recruitment analytics dashboard to evaluate what is working and what needs to change. It is best suited for strategic insight and continuous improvement, not short-term tracking or operational control.
Recruitment funnel dashboard
A recruitment funnel dashboard shows how candidates move through each stage of the hiring process, from application to offer. It highlights where candidates drop out, where they stall, and how long they spend at each stage. Recruiters and hiring managers use this view to pinpoint where the process is slowing down and where changes to screening, interviewing, or decision-making may be needed.
Example metrics commonly included:
- Application-to-screen conversion rate
- Interview-to-offer conversion rate
- Stage-by-stage drop-off rates
- Average time spent in each funnel stage
- Candidate volume at each stage
→ Do this: Review funnel data regularly to identify emerging bottlenecks early, particularly stages with unusually high drop-off rates or extended delays.

Recruitment marketing dashboard
A recruitment marketing dashboard focuses on attraction performance at the top of the hiring funnel. It helps HR and talent acquisition teams understand how effectively employer branding and recruitment marketing efforts are generating interest, qualified applicants, and sustainable talent pipelines.
This type of dashboard is commonly used by TA leaders and employer branding teams to evaluate channel performance, campaign effectiveness, and audience engagement before candidates enter the formal hiring process.
Example metrics commonly included:
- Career site traffic and conversion rates
- Application volume by campaign or channel
- Cost per applicant
- Source engagement and click-through rates
- Talent pool growth over time
→ Do this: Use a recruitment marketing dashboard to optimize attraction strategies and channel mix. Review it alongside funnel and quality metrics to ensure increased volume translates into stronger candidate pipelines, not just more applications.
Candidate experience dashboard
A candidate experience dashboard captures how candidates perceive the recruitment process, including communication, clarity, fairness, and responsiveness. It helps recruiters and HR leaders understand where the hiring experience supports the employer brand and where it creates friction. This view is especially valuable for identifying experience issues that do not immediately appear in speed or volume metrics.
Example metrics commonly included:
- Candidate satisfaction or NPS scores
- Feedback on communication and transparency
- Perceived fairness of the process
- Drop-off reasons from candidate surveys
- Time between candidate touchpoints
→ Do this: Review candidate experience data alongside funnel and time-based metrics to improve the experience without unintentionally slowing down hiring.
Diversity recruitment dashboard
A diversity recruitment dashboard focuses on how equitable and inclusive the hiring process is across different candidate groups. It helps HR and talent acquisition teams understand whether candidates from underrepresented backgrounds are entering the pipeline, progressing through each stage, and being hired at comparable rates. This dashboard is commonly used to support DEI goals, track progress over time, and identify potential bias or structural barriers in the recruitment process.
Example metrics commonly included:
- Candidate demographics by stage of the hiring funnel
- Application-to-interview and interview-to-offer conversion rates by demographic group
- Hiring diversity compared to the applicant pool diversity
- Offer acceptance rates by demographic group
- Diversity of interview panels
→ Do this: Use a diversity recruitment dashboard to identify gaps in representation and progression across the hiring process. Review it alongside funnel and KPI dashboards to spot where inequities emerge and to inform targeted improvements without relying on assumptions.
How to create a recruitment dashboard in 8 steps
Recruitment dashboards work best when they are built with clear intent. The goal is not to visualize every available data point, but to create a reliable view of how hiring is performing and where action is required. Below is a practical, repeatable approach you can use to build a recruitment dashboard that HR and talent teams can trust and use consistently.
Step 1: Pick the decisions the dashboard will drive
Start by writing down the three to five questions the dashboard needs to answer on a regular basis, such as “Where are we losing candidates?” “Which roles need escalation?”, or “Are we on track to hit hiring targets this month?” This creates a clear purpose and helps prevent the dashboard from becoming a “nice-to-have” report that no one acts on. A useful exercise is to ask each key stakeholder to name one decision they expect to make using the dashboard, then build only what supports those decisions.
Step 2: Define the audience and the cadence
Recruiters, TA leads, HR leaders, and hiring managers all need different levels of detail. Recruiters typically need daily visibility into open requisitions and pipeline movement, while HR leaders benefit more from weekly or monthly trend views and early risk signals. Deciding how often the dashboard will be reviewed helps determine the right level of granularity. As a general rule, match cadence to action: daily for operational pipeline management, weekly for bottlenecks and aging issues, and monthly for trends, costs, quality, and workforce planning.
Step 3: Choose a small set of core metrics, then add “diagnostics”
Most effective dashboards focus on a tight set of core metrics, such as time to hire, time to fill, and funnel conversion rates, supported by a small number of diagnostic views that explain movement. These might include breakdowns by role family, location, recruiter, hiring manager, source channel, or hiring stage. The aim is to move from “what happened” to “why it happened” without overwhelming users.
Step 4: Write metric definitions and lock the formulas
Before building anything, document how each metric is calculated, including start and end points, inclusions and exclusions, and time windows. In recruitment, teams often think they are measuring the same metric while using slightly different definitions, which quickly erodes trust. Adding a short “Definitions” panel or tooltip for key metrics can help prevent misinterpretation during reviews and stakeholder meetings.
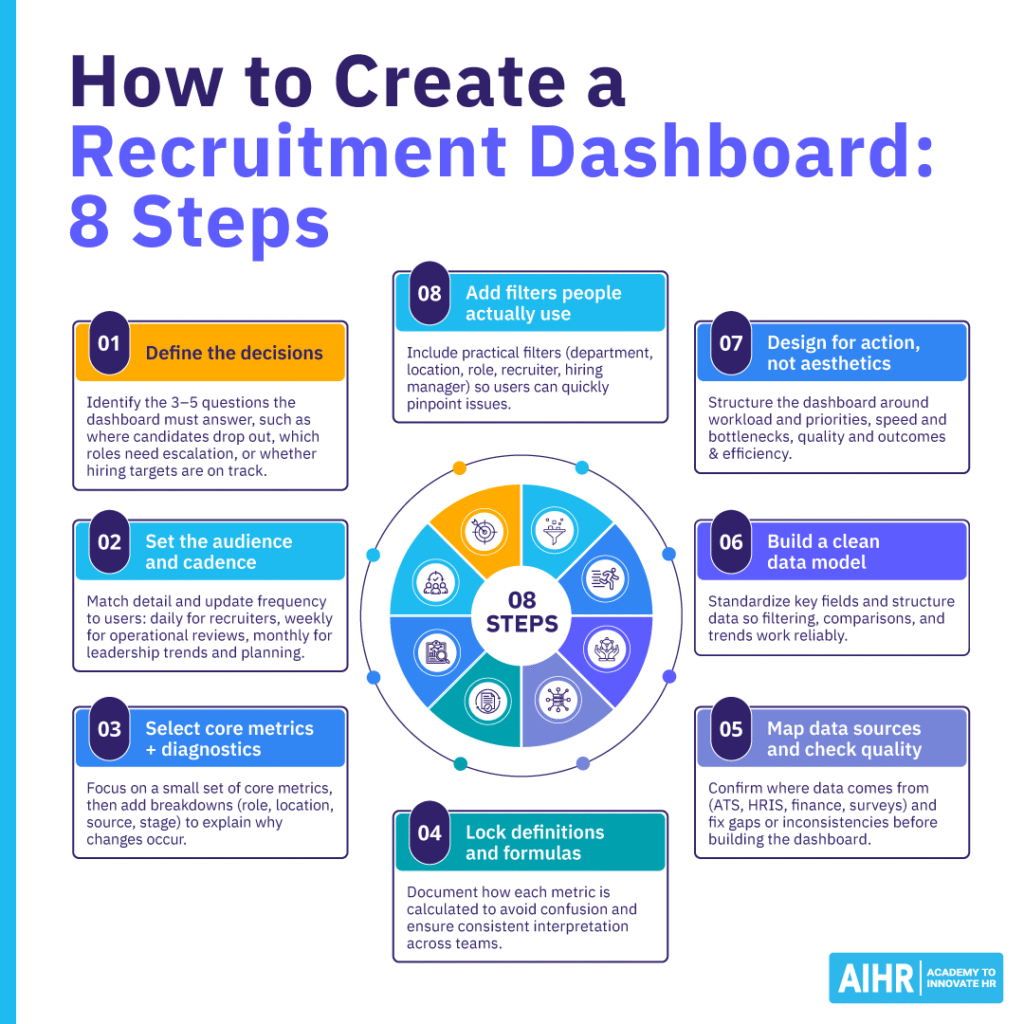
Step 5: Map your data sources and confirm data quality
List the sources of each metric, such as the ATS for applications, stages, timestamps, and offers; the HRIS for start dates and headcount; finance systems for agency fees and advertising spend; surveys for candidate experience; and performance or retention data for quality of hire. Check that ATS stages are used consistently, timestamps are reliable, and source tracking is meaningful. Running a quick audit of 20 to 30 recent hires can help surface missing or inconsistent data. Where issues exist, fix the process first, then build the dashboard.
Step 6: Build the data model (clean, connect, standardize)
Regardless of whether you are using an ATS dashboard, a BI tool, or Excel, you will need a clean underlying dataset. This usually includes one row per candidate with stage history and one row per requisition with role details, targets, and ownership. Standardize key fields such as role family, location, business unit, and source categories so filters and comparisons work consistently.
Step 7: Design the layout around actions, not aesthetics
An effective dashboard layout should follow a clear logic that mirrors how decisions are made, rather than focusing on visual polish alone. A common and practical structure includes:
- Workload and priorities: Open roles, aging requisitions, and at-risk vacancies that require immediate attention.
- Speed and bottlenecks: Time in stage, pass-through rates, and stalled steps in the hiring process.
- Quality and outcomes: Offer acceptance rates, quality of hire, early performance indicators, and candidate satisfaction.
- Efficiency: Cost per hire, channel performance, and return on sourcing investment.
Use a mix of KPI tiles, trend lines, funnel visuals, and tables that allow for drill-down where deeper investigation is needed.
Step 8: Add segmentation and filters that people actually use
Dashboards become most valuable when leaders can quickly answer the question, “Where is the problem?” Common, high-impact filters include department, location, job level, role type, recruiter, hiring manager, and source channel. Keep filters consistent across dashboards so users do not have to relearn the interface, and limit them to options that genuinely support investigation and action.
Common mistakes to avoid when building a recruitment dashboard
Even well-designed recruitment dashboards can fail to deliver value if they are built or used incorrectly. The issues below are common across organizations and can undermine trust, adoption, and impact.
- Treating the dashboard as a static report: Recruitment dashboards should evolve as hiring priorities, roles, and labor market conditions change. Static dashboards often drift out of relevance over time.
- Tracking too many metrics at once: Dashboards that try to show everything often make it harder to see what matters. Without a clear focus on decisions and priorities, users struggle to interpret signals or take action.
- Optimizing for speed alone: Overemphasizing time-based metrics such as time to hire or time to fill can lead teams to trade quality, candidate experience, or long-term outcomes for short-term gains.
- Using inconsistent definitions across teams: When the same metric is calculated differently by recruiters, HR, and finance, dashboards quickly lose credibility. Clear, locked definitions are essential for trust and alignment.
- Reviewing dashboards without ownership or follow-up: Dashboards create value only when insights lead to action. Without agreed-upon owners and next steps, even accurate data becomes passive reporting.
Next steps
Recruitment dashboards create value when they are treated as working tools rather than one-off reporting exercises. Start by choosing one audience, one dashboard, and a small set of metrics, then commit to reviewing it on a regular cadence. Use what you see to ask better questions, remove friction from the hiring process, and focus your efforts where they will have the greatest impact.
If you don’t yet have a dashboard in place, start simple. Pull your most recent hiring data, track a small set of core metrics, and review it in your next recruiter or hiring manager check-in.
FAQ
A recruitment dashboard is a visual, data-driven representation of hiring performance across roles, teams, and over time. It brings together key recruitment metrics such as time to hire, time to fill, pipeline movement, source effectiveness, offer acceptance rates, and hiring outcomes, and presents them through charts, tables, and trend views that are easy to interpret.
Used by recruiters, talent acquisition leaders, HR leaders, and hiring managers, recruitment dashboards support better decision-making by making bottlenecks visible, highlighting priority roles, and indicating whether hiring efforts are translating into the talent outcomes the business needs.
Building a recruitment dashboard starts with defining the decisions it needs to support and selecting a focused set of metrics that reflect hiring speed, efficiency, quality, and candidate experience. Data is then pulled from systems such as the ATS, HRIS, finance tools, and candidate surveys, with clear definitions and formulas agreed upon upfront to ensure consistency and trust.
The dashboard should be designed around action rather than activity, surfacing priorities, risks, and trends instead of raw volume. When reviewed on a regular cadence, recruitment dashboards help teams identify issues early, improve processes, prioritize effort, and strengthen hiring outcomes over time.