
Do you know if your employees are all paid fairly? Are the salaries your organization offers competitive? According to Payscale’s Fair Pay Impact Report, 68% of employees surveyed believe they’re underpaid, even when their earnings are at or above market rates.
Calculating the compa ratio can help you cut through perception and get a clear view of how your pay actually stacks up against the market or your own salary ranges. It’s a simple but powerful tool for guiding compensation decisions.
In this article, we’ll explore what the compa ratio is, how to calculate it, and how to use compa ratio in your compensation strategy. For a deeper dive into essential compensation metrics, download our Compensation Metrics Cheat Sheet and take your C&B strategy to the next level.
Contents
What is compa ratio?
Why is the compa ratio important?
How to calculate compa ratio
What is a good compa ratio?
Compa ratio calculator
Different types of compa ratios
Compa ratio vs. range penetration
Limitations of using compa ratio as a compensation metric
How to use compa ratio in your compensation strategy
FAQ

What is compa ratio?
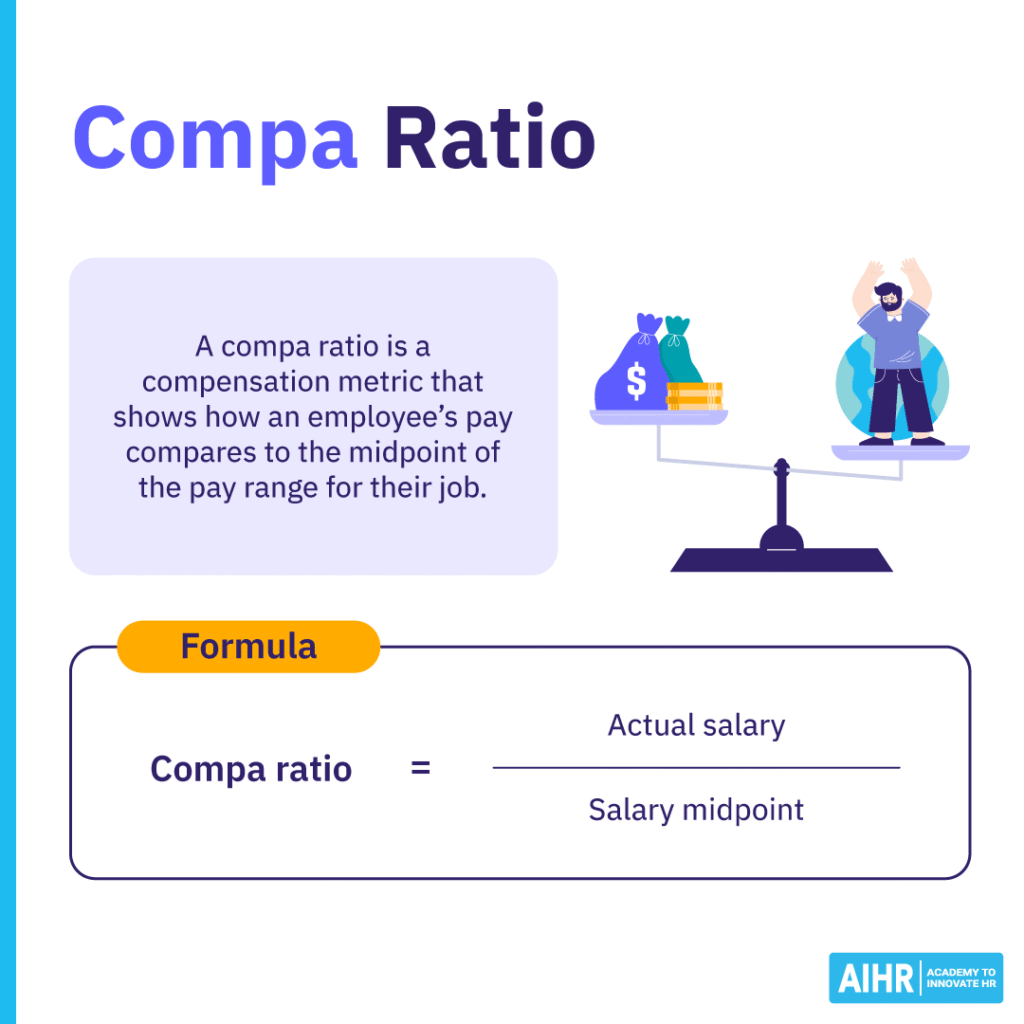
Compa ratio, or comparative ratio, is a metric that compares an individual’s or group’s salary to the midpoint of a defined salary range. It indicates whether an employee or a group of employees is paid below or above market rates and is one of the most widely used compensation metrics.
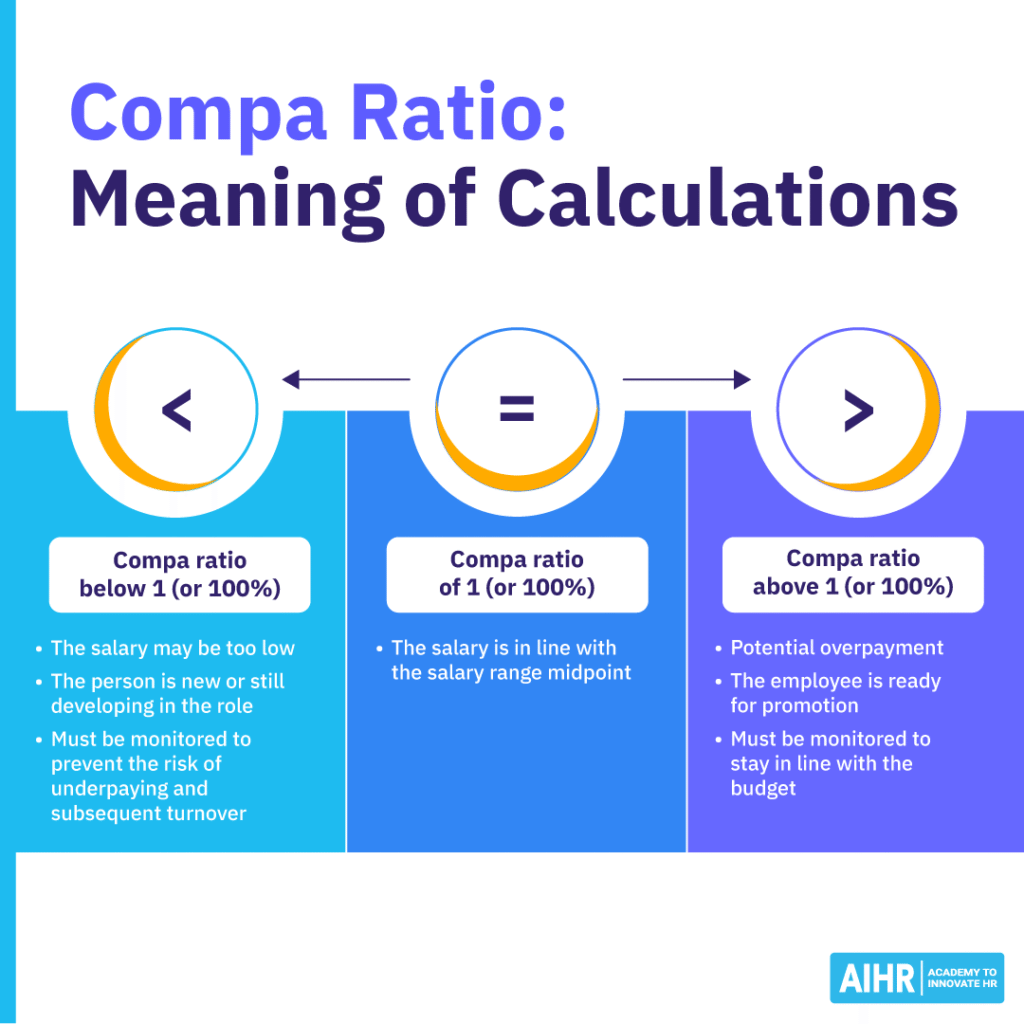
A compa ratio that is too low indicates a risk of losing your top performers to jobs and organizations that offer higher compensation, and also a challenge to replace them. On the other hand, a compa ratio that is too high means that you might be paying your employees more than most other organizations, and this can eat into your bottom line.
You can compare the average ratios of groups, such as departments or teams, to identify differences between them. Identifying these results can help ensure pay equity within and across groups in your organization, as well as inform decisions on pay raises and promotion potential.
HR and compensation professionals have found various ways to utilize the compa ratio metric. As a result, it has become one of the most helpful ratios in pay and compensation analysis.
Why is the compa ratio important?
Salary decisions involve budgets, market data, and fairness. Compa ratios give you a quick, reliable way to see whether pay is in line with your ranges and compensation strategy.
- Assessing pay competitiveness: A compa ratio shows how an employee’s salary compares to the midpoint of the range. If many ratios are low, your pay might be falling behind the market. If they’re consistently high, you may be overspending. This helps you keep salaries aligned with your compensation philosophy.
- Identifying internal pay equity issues: Compa ratios make it easier to spot inconsistencies. If employees in similar roles have very different ratios, it’s a signal to review how salaries are being set. Looking at ratios across teams or demographics can also highlight broader equity gaps that need attention.
- Making fairer pay and promotion decisions: Managers use compa ratios to guide raises and promotions. Someone far below the midpoint may need a stronger adjustment, while someone already above the midpoint might be better recognized through bonuses or development opportunities. It keeps decisions grounded in data.
- Budgeting and planning more effectively: Patterns in compa ratios help you see where salary budgets should go. Clusters of low ratios may indicate retention risks or market misalignment. High ratios can show where teams are already well compensated. This supports more targeted, efficient compensation planning.
Are you relying on gut instinct to make compensation decisions? Compa ratios are just the beginning. To build a truly fair, competitive, and future-proof pay structure, you need to go deeper.
AIHR’s Compensation & Benefits Certificate Program will teach you how to:
✅ Master core compensation metrics like compa ratio, range penetration, and market benchmarks
✅ Analyze pay gaps and design equitable, data-backed compensation strategies
✅ Develop a Total Rewards strategy that aligns with business goals
✅ Use analytics to optimize salary decisions and ensure internal fairness
💡 Build the compensation expertise to make pay decisions more data-driven.
How to calculate compa ratio
Here are the key steps for calculating compa ratios across your organization:
Step 1: Identify the salary midpoint
Decide which midpoint you want to use. This could be the midpoint of an internal salary range, a market midpoint from compensation surveys, or the average pay for a defined group. Choosing the right midpoint upfront keeps your comparisons consistent.
Step 2: Gather the required data
Collect the actual salaries for the employees or roles you’re evaluating, along with the midpoint values tied to each job. Your HRIS or compensation management system will usually house this information. Make sure the midpoint data is current and based on recent market or structural updates.
Step 3: Apply the compa ratio formula
Once you have the necessary data, calculate the compa ratio using this formula:
| Compa ratio = | Actual salary | |
| Salary midpoint | ||
To see the result as a percentage, multiply by 100.
You can calculate a compa ratio for an individual employee, a team, job family, or your entire workforce.
Step 4: Interpret the results
Review the ratios to see whether employees sit below, at, or above the midpoint. Looking at these patterns across departments, job levels, or demographic groups can help you identify internal equity issues or structural gaps in your compensation ranges.
Compa ratio example
Let’s say the market midpoint for a Trainee Buyer is $30,000, and Trainee Buyer A earns $35,000. The calculation looks like this:
35,000 ÷ 30,000 = 1.16
1.16 × 100 = 116.6%
This shows that Trainee Buyer A is paid above the midpoint. This may be due to previous experience, strong performance, or simply working for an organization that pays above typical market rates for the role.
What is a good compa ratio?
A good compa ratio is usually one that sits close to the salary midpoint, which is 1.0 (or 100 percent). This shows that pay is aligned with the organization’s compensation structure and market expectations.
In many organizations, a range of 0.8 to 1.2 (80 to 120 percent) is treated as acceptable.
- A ratio below 1.0 means pay falls under the midpoint. This can make sense for employees who are new to the role or still building their skills, and you’ll often see developing employees between 0.8 and 0.9. That said, ratios that stay too low for too long may indicate underpayment and can lead to retention challenges.
- A ratio around 1.0 suggests pay is right where the organization intends it to be based on market data or internal policy.
- A ratio above 1.0 means pay is higher than the midpoint. This can reflect strong performance, significant experience, or readiness for a promotion. When a group or entire department sits above the midpoint, it may also signal potential budget pressure.
So, a “good” compa ratio depends on context, but most organizations aim for the mid-range while allowing some variation based on experience, performance, and market conditions.
HR tip
Go beyond individual ratios and review group-level trends by tenure, gender, job family, and department. This helps you uncover patterns that may point to structural pay issues, outdated ranges, or inconsistencies in how managers make pay decisions.
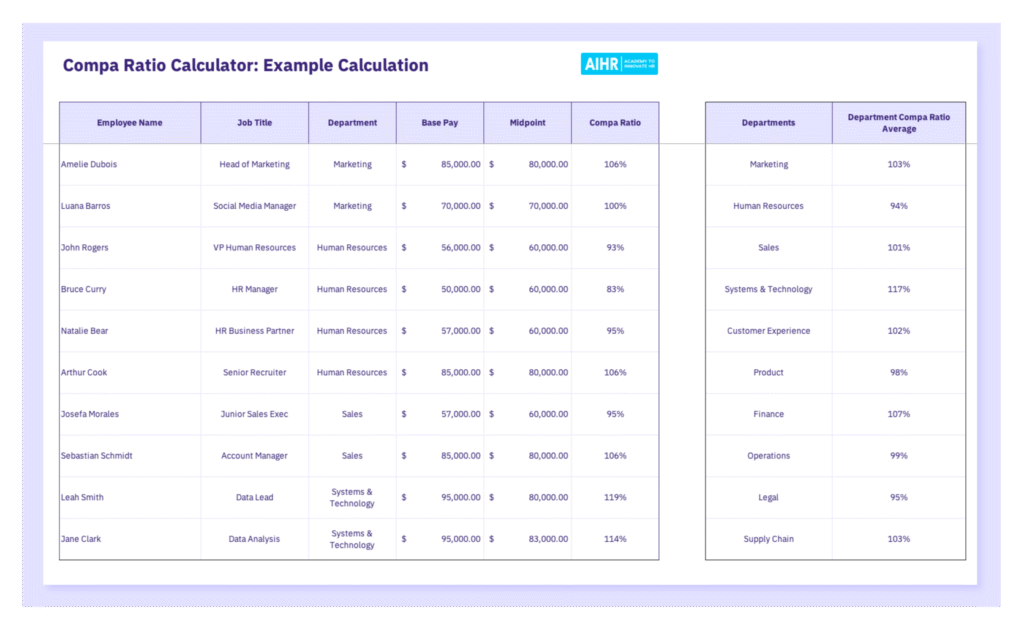
Compa ratio calculator
To make running your own calculations easier, we’ve put together a downloadable Excel template. You can use it whenever you want a quick, structured way to review salaries and midpoints, and to get a clearer sense of how pay compares across roles or teams.
Different types of compa ratios
1. Individual compa ratio
An individual compa ratio compares an employee’s actual salary to the midpoint of the salary range for their role.
| Compa ratio = | Employee salary | |
| Range midpoint | ||
For example, an employee’s salary is $47,200, and the midpoint of the salary range is $52,000. The compa ratio will be:
47,200 / 52,000 = 0.908
x 100 = 90.8%
Compa ratio without pay ranges
If you do not use formal pay ranges, you can calculate compa ratios against a market average or salary survey midpoint instead.
For example, Employee A earns $46,000, and the market average is $50,000:
46,000 / 50,000 = 0.92
x 100 = 92%
This also works with your pay policy. For example, if your policy is to pay employees at 15% above the market rate of $50,000, the formula will be:
| Compa ratio = | Actual salary | |
| (Market average x (1+0.15) | ||
Here’s an example for Employee A:
46,000 / 50,000 × (1+0.15) = 46,000 / 57,500 = 0.8
x 100 = 80%
If you pay new hires at 10% below market, the compa ratio formula for Employee A is:
| Compa ratio = | Actual salary | |
| (Market average x (1-0.10) | ||
For our example, this formula is:
46,000 / (50,000 × (1-0.9)) = 46,000 / 45,000 = 1.02
x 100 = 102%
How the individual compa ratio works
Most companies start new employees near the lower end of the salary range, or at a set percentage above it, providing room for growth as skills and experience increase. Pay adjustments are typically larger at the beginning of an employee’s tenure and decrease in size as the salary approaches the midpoint.
It’s common for organizations to keep salaries within a range of roughly 10 to 20 percent on either side of the midpoint. Top performers or highly experienced new hires may move more quickly through the range or start higher.
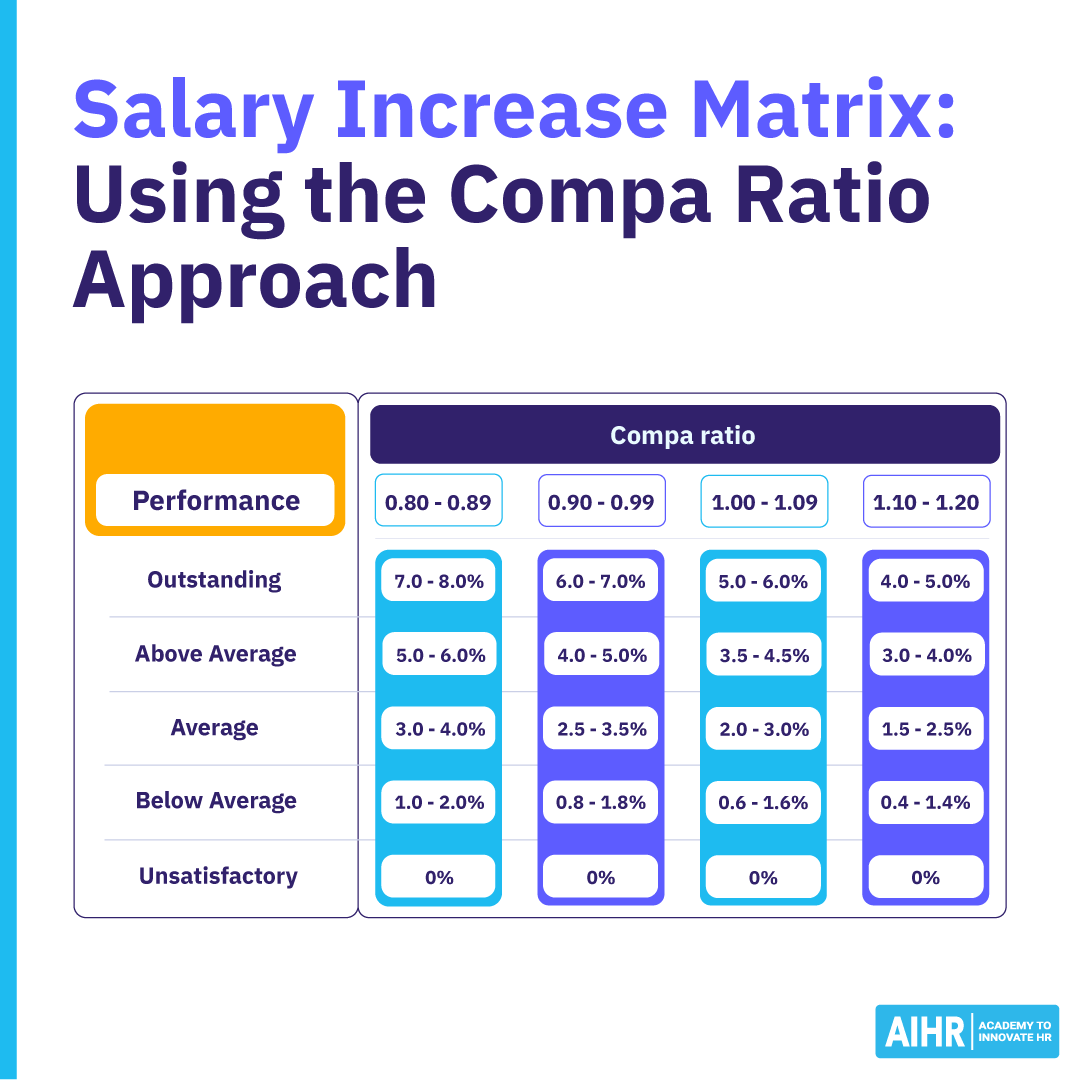
Compa ratios help organizations plan how quickly employees should progress toward the midpoint or toward the market benchmark. This table from WorldatWork shows how to create a merit increase table using compa ratio.
Pay and seniority
In civil service systems or workplaces where seniority determines pay movement, compa ratios can highlight inconsistencies between experience and pay. If employees with similar seniority have noticeably different compa ratios, it can trigger a broader compensation review for the entire group.
2. Group compa ratio
A group compa ratio looks at how the pay of an entire team or department compares to your compensation policy. Instead of evaluating one employee at a time, it compares the total amount paid to the total of the job reference points (such as salary midpoints).
| Group compa ratio = | Sum of actual salaries | |
| Sum of job reference point rates | ||
In practice, this is easy to calculate in Excel by summing all employee salaries in one column and all midpoint or reference point values in another.
Example
Let’s take a team of five employees. Their total salaries add up to $260,000, and the total of their midpoints is $280,000.
260,000 ÷ 280,000 = 0.93, or 93%.
This tells you the group is slightly below the intended midpoint.
Organizations use the group compa ratio to see whether pay practices match the compensation strategy and whether budget allocation is drifting off course. Differences in this ratio often have clear explanations.
Common reasons the group compa ratio may be lower include:
- Shorter average tenure in the role
- Higher resignation rates are tied to slowed or skipped merit increases
- Faster promotions during periods of expansion
- More internal transfers bringing in newer employees.
Reasons it may be higher include:
- Longer tenure or limited promotion opportunities
- Retaining strong performers who stay in individual contributor roles
- Market pressure to increase pay for certain roles.
Sometimes a shift in the ratio points to deeper issues with pay structure or job design.
Potential structural causes include:
- Pay ranges that no longer match the market
- Inconsistencies after introducing a new structure
- Jobs that have changed and need re-evaluation.
A group compa ratio can also flag differences among demographic groups, prompting you to check for potential bias or inconsistent application of pay practices.
It’s important to treat the group compa ratio as a signal rather than an answer. It points you in the right direction, but a more in-depth review is necessary to understand the underlying cause.
3. Average compa ratio
The average compa ratio shows how a group is positioned relative to the midpoint on average. It is calculated by adding all individual compa ratios together and dividing by the number of employees included.
| Average compa ratio = | Sum of individual compa ratio | |
| Number of individuals | ||
Example
If the total of all individual compa ratios is 242.79 and there are 232 employees, the calculation is:
242.79 ÷ 232 = 1.05, or 105%
This gives you a quick snapshot of where the group sits overall. Sometimes the result makes perfect sense based on tenure, market conditions, or business decisions. Other times, it may signal that adjustments are needed.
When the average compa ratio falls outside your guidelines, common responses include:
- Having HR business partners support managers in making more consistent pay decisions
- Speeding up salary increases so the group moves closer to the target level
- Slowing future increases and using one-time bonuses to retain higher-paid employees
- Adding more structure and oversight to manager ratings and pay reviews.
Compa ratio vs. range penetration
What it measures
How an employee’s pay compares to the midpoint of the salary range
How far an employee’s pay has progressed between the minimum and maximum of the range
How it’s calculated
Employee salary ÷ Range midpoint
(Employee salary – Range minimum) ÷ (Range maximum – Range minimum)
What it tells you
Whether someone is paid below, at, or above the midpoint. Useful for market alignment, internal equity, and pay decisions.
Where the employee sits within the full range. Useful for tracking progression, tenure, and whether someone is approaching the maximum.
Example
If the midpoint is 50,000 and the employee earns 50,000, the compa ratio is 100%
If the range is 40,000 to 60,000 and the employee earns 50,000, the range penetration is 50%
Limitations of using compa ratio as a compensation metric
While compa ratio is a helpful metric for HR and compensation professionals, it does have some limitations:
- A narrow focus on base pay: The metric reflects base salary alone, excluding bonuses, equity, benefits, and non-monetary rewards. As a result, it may not capture the real value of an employee’s total compensation package.
- Oversimplifies compensation decisions: Pay is shaped by performance, skills, experience, scarcity of talent, and organizational priorities. Compa ratio compresses these factors into a single number, which makes it easy to use but limits how well it explains why someone is paid at a certain level.
- Leans toward internal comparisons: It is most useful for reviewing internal pay equity, yet it tells you very little about how competitive your salary ranges are in the market. A team might look balanced internally even if the entire range is behind market rates.
- Depends heavily on the accuracy of salary ranges: If the salary range or midpoint is outdated, misaligned with the job content, or based on weak market data, the compa ratio will not reflect reality. The metric is only as reliable as the ranges it is based on.
- Does not account for job scope variations within the same title: Employees who share a job title may assume different responsibilities or handle work with varying levels of complexity. Compa ratio cannot distinguish between these differences, which can make a perfectly reasonable pay decision appear out of line.
How to use compa ratio in your compensation strategy
Here are the key steps for using compa ratio to support fair, consistent, and transparent pay practices across your organization.
Step 1: Conduct frequent reviews
Review compa ratios on a regular basis to keep your pay practices aligned with your compensation philosophy. These check-ins can highlight imbalances early.
For instance, if you notice that women consistently have lower ratios than men in comparable roles, it’s a sign that your compensation and benefits strategy needs adjustment to close that gap.
Step 2: Compare ratios in context
Looking at compa ratios on their own can be misleading. A clearer picture emerges when you compare them to tenure, performance, and the actual responsibilities someone carries.
This additional context helps you distinguish between a genuine pay gap and a situation where an employee is still gaining experience and naturally falls within a lower range.
Step 3: Assign a “next review date” to each role
This can be as simple as maintaining a calendar of role-specific checkpoints. When those checkpoints come around, make group compa ratio analysis part of the review so each job family stays aligned with your compensation philosophy.
Step 4: Strengthen your people analytics capability
Expanding your people analytics capability helps you turn compa ratio data into something more actionable. When you integrate compensation figures with information on performance, roles, tenure, and market shifts, you get a more complete view of how pay is distributed and where you should direct your attention. This gives your compensation strategy a stronger analytical base.
To make this possible, HR and compensation professionals need to build skills in data interpretation, visualization, and basic analytics tools. With those capabilities in place, you can automate compa ratio calculations, create dashboards that surface changes quickly, and spend more time advising leaders instead of recalculating figures.
Step 5: Avoid relying on compa ratio alone
Compa ratio is a starting point, not a full explanation. It highlights patterns but won’t tell you the story behind them.
For instance, if your managers have lower-than-average compa ratios compared to the industry midpoint, the cause might be something straightforward, like a wave of recent promotions, rather than inequitable pay practices.
Step 6: Use additional compensation metrics
To round out your view of competitiveness and equity, combine compa ratio with:
- Salary range penetration
- Market ratio
- Target percentile
- Geographic pay differentials.
Step 7: Practice open and clear communication
Sharing how you use compa ratio helps build trust in your compensation process. You might do this through a brief explanation in a company newsletter or by providing employees with access to a concise guide that outlines what the metric reveals and what it doesn’t.
Step 8: Provide manager training
Managers are often the first people employees turn to with questions about pay, so it’s worth giving them the tools to respond clearly. Training sessions or short guides can help them handle common questions and explain compa ratio in a way that employees understand.
Over to you
As with all metrics, the compa ratio’s value lies not in the ratio itself but in how you use this information. Compa ratio is the beginning of an investigation, not the end.
There can be multiple reasons for an organization’s ratios to be under or over the midpoint. It’s essential to continue researching and analyzing the data until you identify the underlying issue, allowing you to offer fair and competitive compensation to all your employees.
FAQ
A good compa ratio depends on factors such as industry, location, and employee experience. In most organizations, a healthy range falls between 0.8 and 1.2, or 80% to 120%, with ratios near 1.0 typically indicating strong alignment with market and internal pay structures.
A 90 compa ratio means the employee is paid at 90 percent of the salary midpoint for their role. This indicates their pay sits slightly below the target midpoint used for compensation comparisons.
A compa ratio of 0.75 means the employee is paid at 75% of the salary midpoint for their role, placing their pay noticeably below the reference midpoint used for comparison.
Compa ratio is calculated by dividing an employee’s actual salary by the salary midpoint for their role:
Compa ratio = Actual salary ÷ Salary midpoint
To express it as a percentage, multiply the result by 100.