
HR reporting and analytics turn scattered HR data into decisions leaders act on. With the right metrics, dashboards, and narratives, you can spot flight risks earlier, forecast skills needs, and tie workforce investments to revenue, margin, and risk. Yet, only 10% of organizations directly link workforce data to business in a meaningful, systemic way.
Clearly, there is a need for HR to support the case for efficient reporting and analytics. This article discusses what this entails, which HR metrics to include when doing so, and the best HR reporting and analytics tools you can use to help you in the process.
Contents
What is HR reporting and analytics?
What is HR reporting?
What is HR analytics?
The impact of HR reporting and analytics
9 best HR reporting and analytics tools
Relevant HR metrics to use in reporting and analytics
Key takeaways
- Reporting shows what happened; analytics explains why and what next.
- Clean, standardized data and access controls are essential for accurate reporting and analytics.
- Start with a few business-linked metrics and simple dashboards before going into further detail and scaling up.
- Use analytics to predict risks, identify and close skills gaps, and prove ROI.
What is HR reporting and analytics?
HR reporting and analytics are related but different. Knowing the difference — and moving from collecting data to turning it into insights — helps HR shift from service to strategy. Think of it this way: HR reporting is your car’s dashboard, while HR analytics is the investigation you conduct when a warning light comes on to find the cause and decide what to do next.
HR reporting is descriptive. It looks back to answer “What happened?” using standard metrics to offer a consistent, high-level view, but they don’t explain the full story. HR analytics is diagnostic and forward-looking. It uses report data to spot patterns, uncover root causes, and make predictions. It answers “Why did it happen?” and “What should we do next?”
This deeper analysis goes beyond basic compliance (for example, meeting EEO and pay equity rules). Done well, HR analytics improves decisions across recruitment, retention, and fair people decisions.

What is HR reporting?
HR reporting is the backbone of any data-driven team. This information provides you with a detailed snapshot of what’s currently happening.
What it is: HR reporting tends to involve predefined, routine data outputs collected weekly, monthly or quarterly, and pulled directly from HRIS, ATS, and payroll systems. By standardizing your reporting, you can ensure everyone in your company looks at the same trusted datasets.
Typical formats: Reports deliver the key operational metrics managers and senior leaders require. Data is usually displayed in HR dashboards and exported in user-friendly formats, such as CSV and PDF files required for HR audit reports or government submissions.
Examples of foundational metrics: HR reports typically detail the current state of your workforce, using metrics like headcount, new hires, terminations, time to fill, and absenteeism. These are objective data views you can use to fuel deeper HR data analysis on areas of concern or strength.
Why it’s important: Consistent and accurate reporting provides operational transparency and supports regulatory compliance. Clean, verified data also provides a baseline required for more advanced HR analytics to address the questions of “why” and “what next?”
Different types of HR reports: HR reports generally fall into three categories — operational (e.g., daily attendance), regulatory (e.g., EEO-1, OSHA) or strategic (e.g., executive summaries on factors like skills availability and succession readiness).
Build crucial reporting and analytical skills to boost HR’s value
To analyze HR metrics accurately and report your findings effectively, you must align metrics to business goals, clean and validate data from one source of truth, secure access, and present insights with clear visuals and next steps.
✅ Create and implement HR metrics aligned with your organization’s strategy
✅ Communicate data effectively with compelling reports and storytelling techniques
✅ Analyze HR data to calculate ROI and demonstrate HR’s strategic value
✅ Benchmark your HR metrics to determine HR’s efficiency and impact
Learn at your own pace with the online HR Metrics & Dashboarding Certificate Program.
What is HR analytics?
HR analytics is the professional discipline of transforming static data into dynamic, predictive insights. Also called people analytics or workforce analytics, this practice represents HR’s highest data maturity level. It strategically links people outcomes (e.g., skills and experience) directly to business performance.
What it is: HR data analysis involves gathering and analyzing people data, often combined with finance and operations numbers to understand your workforce better. The goal is to use data to inform decision-making by diagnosing ‘why something happened’ and predicting ‘what will happen next’ to improve results.
Common uses and applications: Analytics in HR focus on improving the outcomes needed to achieve company goals. For instance, they include finding hidden turnover patterns, scientifically measuring recruiting success, pinpointing critical skills gaps, optimizing pay and benefits packages, and accurate workforce forecasting.
Why it matters: Adopting HR analytics fundamentally transforms HR’s role, elevating it from an administrator or service provider level to a strategic business advisory level. In-depth insights derived from analytics can help you make better decisions, and prove ROI to build stronger business cases for new HR initiatives.
They can also help you identify what really works and what doesn’t. By modeling different workforce scenarios, this quantitative approach can also better prepare your organization for future change.
The impact of HR reporting and analytics
Integrating HR reporting and analytics can establish your HR team as a critical driver of overall business success through their ability to proactively predict talent gaps and optimize labor costs. Here’s how:
Reporting provides clean, consistent inputs
The first step to maximizing the impact of HR reporting and analytics is making sure you’re working with reliable data. Consistent reporting creates a single source of truth, which is vital for all aspects of HR data analysis. In order to ensure insights are both strategic and trusted, you must use verified and standardized datasets as your key source of information.
Analytics transforms inputs into insights
HR analytics uses reliable data to turn facts into actionable intelligence. When looking to provide answers to ‘why’ and ‘what if’ questions, these insights can empower leaders to make data-backed decisions. This allows them to make decisions that can improve the employee retention rate, and optimize strategic workforce planning and capacity.
What a workflow typically looks like
Imagine your organization’s quarterly turnover report reveals a spike in exits. After an analysis, you isolate key data to pinpoint the root cause. For instance, if you discover that nearly 60% of high performer turnover happens under specific leaders, you’ll have a starting point to look for potential patterns in their leadership that may contribute to turnover.
You can then implement targeted coaching for those leaders and track on-the-ground success by adding a leading indicator — such as employee sentiment scores — to your report to measure success in real time.
Data quality, governance, and access controls
Your overall success with analytics depends on data quality and strong governance, which standardizes definitions and capture processes. This, in turn, will help prevent flawed analyses.
Market-leading platforms protect sensitive data by using role-based access security measures, ensuring users (such as line managers) can access only information relevant to their respective teams. This safeguards confidentiality while delivering the necessary insights to the right decision-makers.
9 best HR reporting and analytics tools
The following platforms and apps feature promising, customizable HR analytics and reporting capabilities. However, the best HR reporting and analytics tools for your company depend on its size, existing HR technology stack, and analytical maturity.
1. Visier
Recognized for enterprise-grade people analytics in HR, Visier provides AI-enabled expertise to integrate people data from various apps to deliver workforce insights. It can help you understand headcount and demographic trends, specific turnover causes and exit risks, and select and hire top performers.
2. ADP DataCloud (Workforce Now Insights & Reporting)
ADP DataCloud provides standard and customizable reporting capabilities directly tied to your organization’s payroll and core HR data. It also includes access to powerful U.S. benchmarking data, which can help you see how your company compares to 1.1 million other employers in more than 1,000 industries.
3, UKG Pro People Analytics
Offering a highly integrated approach, UKG Pro People Analytics links workforce data across HCM and payroll functions to manage your company’s entire employee life cycle, from ‘hire to retire’. It focuses on delivering actionable people analytics, enriched by AI and sentiment insights benchmarked against over 100 million UKG survey responses.
4. Workday Peakon Employee Voice
While known for its AI-powered employee listening, Workday Peakon Employee Voice’s strength lies in transforming continuous feedback into employee engagement analytics. This feeds predictive models that help you understand when employees are at risk of leaving, enabling you to promptly take action to prevent this from happening.
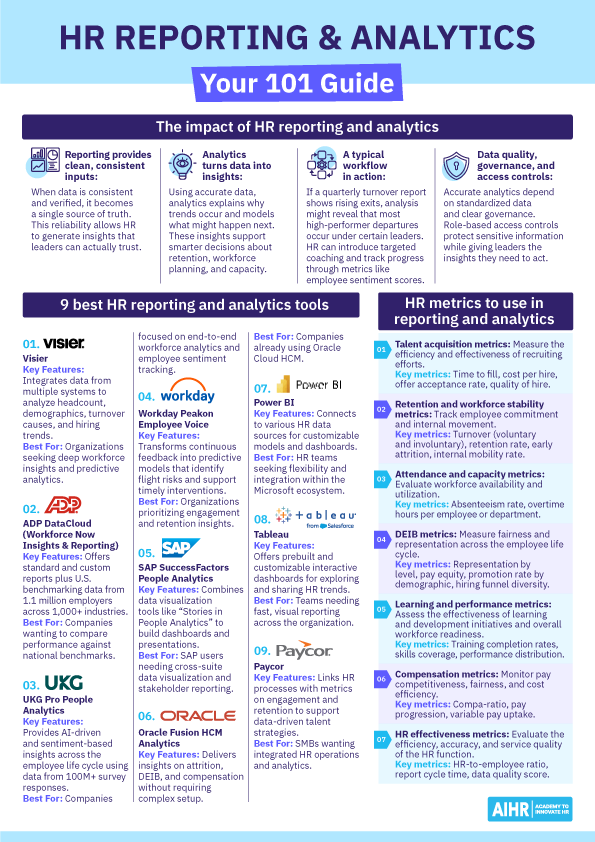
5. SAP SuccessFactors People Analytics
SAP SuccessFactors People Analytics offers unified reporting and analysis across the SAP SuccessFactors suite. It features ‘Stories in People Analytics’, which allows you to combine and visualize datasets. You can then use these to create custom dashboards and compelling presentations to get key stakeholder buy-in.
6. Oracle Fusion HCM Analytics
Built specifically for Oracle Cloud HCM users, Fusion HCM Analytics offers prebuilt analytical content across key Human Resources subject areas, including attrition, DEIB, and compensation, delivering in-depth insights without unnecessary complexity. If your company already uses Oracle Cloud HCM, this is an easy choice.
7. Power BI
As a general business intelligence (BI) platform, Power BI is ideal for HR teams who need to create custom models and dashboards. It allows for deep HR data analysis and flexibility by connecting to various HR data sources. And since it’s a Microsoft offering, organizations already committed to that ecosystem will find Power BI for HR easy to use.
8. Tableau
Known for its strong visual data exploration capabilities, Tableau enables self-service reporting and visual Human Resources analytics. It supports a range of pre-built and customizable interactive dashboards, offering you flexibility and speed in analyzing HR data trends and sharing them across your entire organization.
9. Paycor
Geared toward the SMB market, Paycor provides an integrated HR management system with reporting and HR analytics. It connects core HR tasks with metrics focused on engagement and retention, helping small to mid-sized companies build data-supported talent strategies based on their primary workforce information.
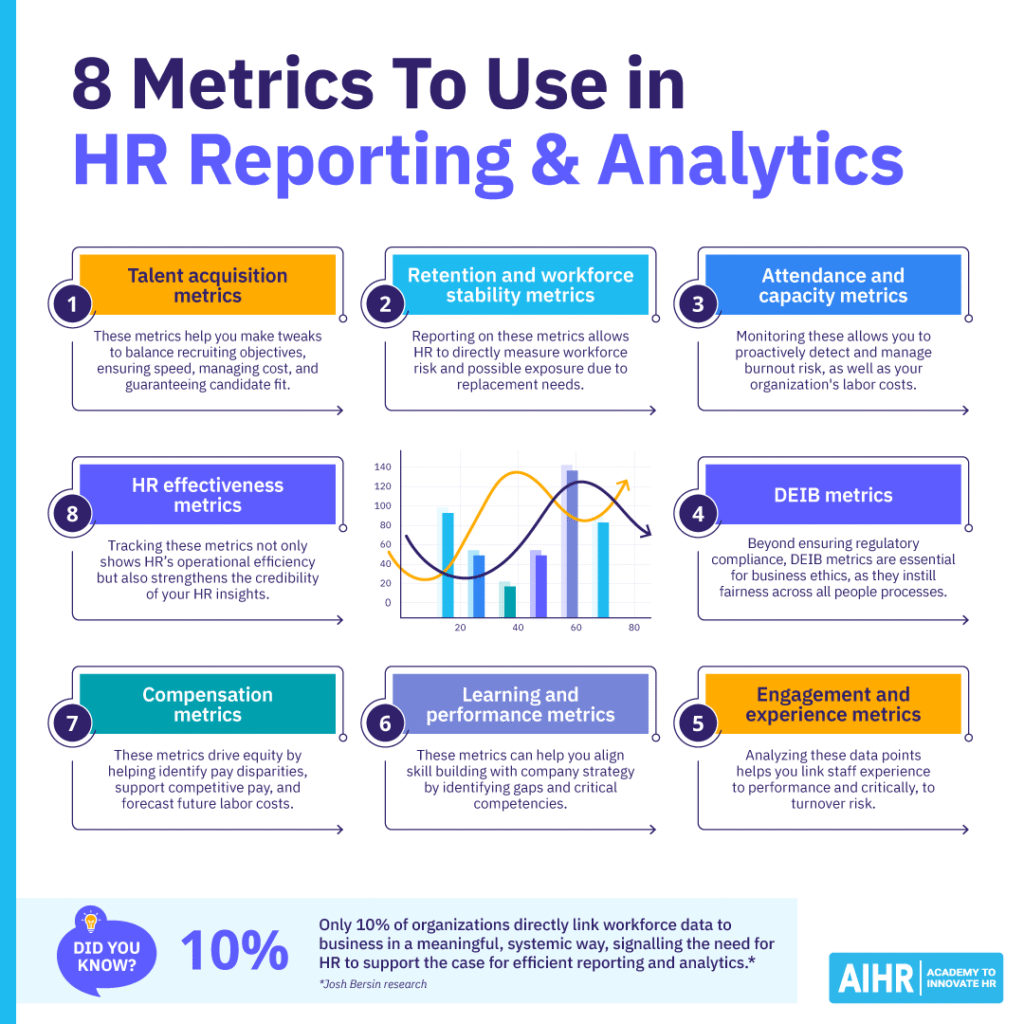
8 relevant HR metrics to use in reporting and analytics
To gain real value from your HR reporting and analytics, it’s important to focus on HR metrics that can provide insights that connect ‘people data’ to business outcomes. The following HR metrics examples provide the raw material needed to inform your HR data analysis and strategic decision-making:
1. Talent acquisition metrics
These metrics track both the efficiency and effectiveness of your recruiting efforts. These should include time to fill, cost per hire, offer acceptance rate, and quality of hire.
Why use these metrics
- They help you make tweaks to balance your recruiting objectives, ensuring speed, managing cost, and guaranteeing candidate fit.
- Analytical insights derived from this information can help optimize sourcing channels, measure recruiter efficiency, and accurately forecast the capacity of your recruitment team to support future hiring needs.
2. Retention and workforce stability metrics
These measures help quantify employee commitment and movement within your organization. Core metrics include turnover (voluntary and involuntary), overall retention rate, early attrition, and internal mobility rate (promotions or lateral moves).
Why use these metrics
- Reporting on retention and workforce stability figures allows HR to directly measure workforce risk and possible exposure due to replacement needs.
- Analytics uses this data to target hotspots (departments, roles, or managers with high turnover), implement preventative measures to reduce replacement costs, and proactively preserve your institutional knowledge.
3. Attendance and capacity metrics
These metrics evaluate your workforce’s availability and utilization. Key data points include the absenteeism rate, and overtime hours worked per employee or department.
Why use these metrics
- Tracking attendance and capacity is vital for both operational cost control and workforce health.
- By monitoring these, HR can proactively detect and manage burnout risk (often signaled by excessive overtime or chronic absenteeism) and labor costs.
- Access to this data allows for more precise staffing plans and scheduling optimization.
4. DEIB metrics
Diversity, Equity, Inclusion, and Belonging (DEIB) metrics quantify fairness and representation in your company across the employee life cycle. Examples include representation by level (e.g., gender equality regardless of role seniority), pay equity, promotion rate by demographic, and hiring funnel diversity.
Why use these metrics
- Beyond simply ensuring regulatory compliance, DEIB metrics support ethical businss practice by instilling fairness across all people processes.
- Analytics in this area helps you identify a lack of diversity or bias, allowing your company to target broader talent pools and ensure an equitable employee experience.
5. Engagement and experience metrics
These assess how employees feel about their work environment. They may include your eNPS, survey participation rates, manager action rates (e.g., follow-up on survey results), and staff sentiment trends you spot in qualitative feedback.
Why use these metrics
- Analyzing these data points helps you link staff experience to performance and critically, to turnover risk.
- High engagement scores are typically correlated with high productivity, while low scores can indicate attrition. This allows you to intervene before key talent leaves.
6. Learning and performance metrics
These measure the effectiveness of your development efforts, as well as your team’s readiness. Examples include training completion rates, skills coverage (the percentage of core skills your current workforce has), and performance distribution (the spread of employee ratings across different levels of achievement).
Why use these metrics
- These metrics can help you align skill-building with overall company strategy by showing where critical competencies exist and where there are gaps.
- This data is also essential for succession planning and targeted development spending.
7. Compensation metrics
These metrics help ensure your pay strategies are competitive, equitable, and budget-friendly. Relevant metrics include compa-ratio, pay progression, and variable pay uptake.
Why use these metrics
- Effective HR reporting on these metrics helps ensure equity by identifying potential pay disparities, and supports retention efforts by confirming competitive pay levels.
- These metrics also help you ensure responsible budget checks and forecasting for future labor costs.
8. HR effectiveness metrics
These metrics help assess the efficiency and service delivery quality of your HR function. They include your HR-to-employee ratio, report cycle time (how long it takes to fulfil a data request), and data quality score, which indicates a measure of system data accuracy.
Why use these metrics
- Tracking HR efficiency metrics not only proves the function’s operational efficiency, but also strengthens the credibility of insights you deliver to the business.
- An effective and accurate HR department is crucial for supporting complex analytics.
To sum up
Treat reporting as your foundation and analytics as your engine. Standardize definitions, clean data, and secure access. Then, use analytics to explain why trends happen, model scenarios, and show the impact on revenue, margin, and risk. When leaders see clear links between people metrics and business outcomes, HR’s position becomes more prominent.
Start small and scale. Pick a few metrics tied to a priority (e.g., early attrition or skills gaps), build a simple dashboard, add leading indicators, and track outcomes. As you prove ROI, expand your scope and tools. The goal is simple: move from counting people to creating value with people — and make HR a measurable driver of growth.


